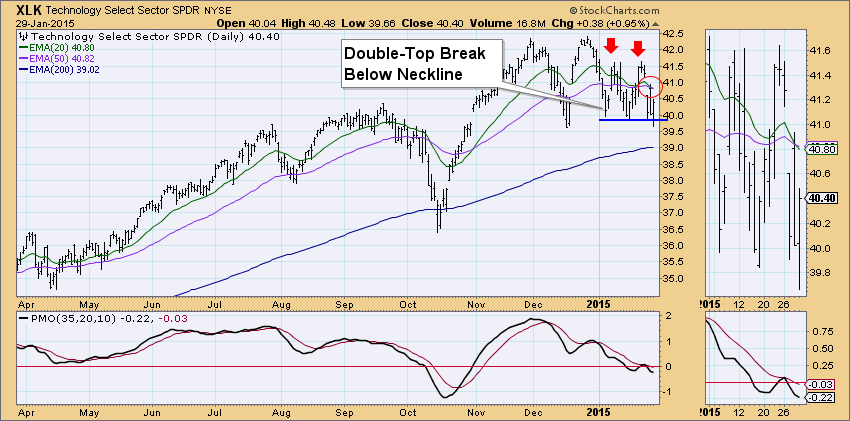
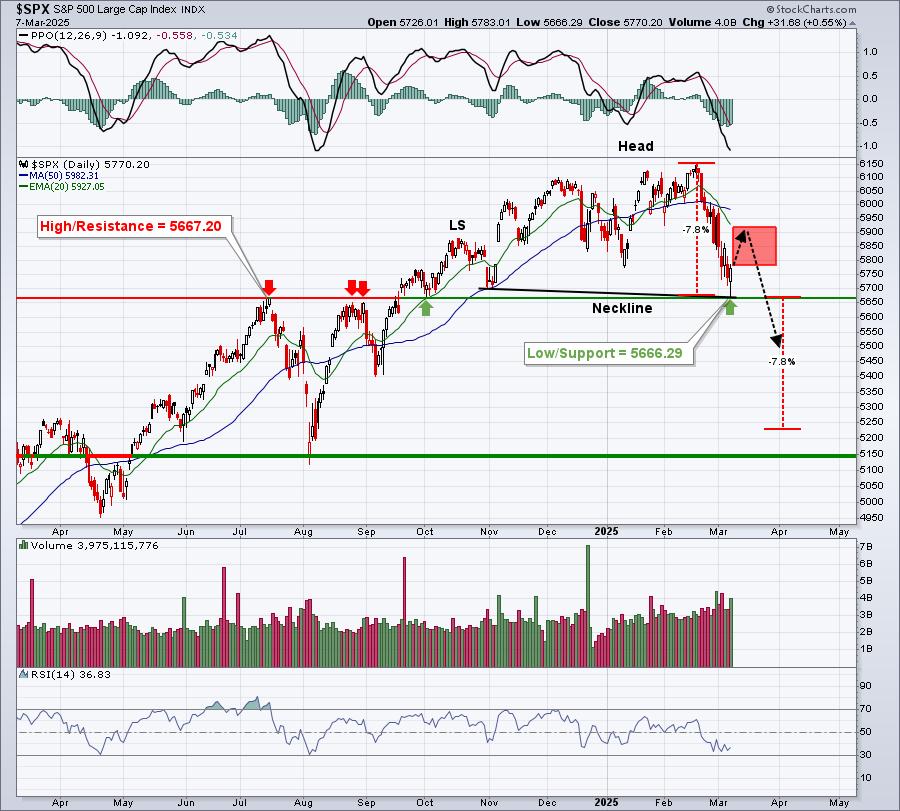
The Technology ETF (XLK) looks a lot like the SPY (see DecisionPoint Blog article, "Double-Top and Initiation Impulse Spell Trouble") which is not a good thing right now.
First, the DecisionPoint Intermediate-Term Trend Model generated a Neutral signal when the 20-EMA crossed below the 50-EMA. It was not considered a SELL signal by the Trend Model because the 50-EMA was above the 200-EMA when the crossover occurred. The Price Momentum Oscillator (PMO) was unable to affect a positive crossover and in fact turned down below its EMA which is very bearish. The next problem for XLK is the bearish double-top formation that is in the process of executing. Price broke below the neckline today but closed well above it, so I don't see it as a true fulfillment of the pattern. This is about the only positive on this chart.
You can find Trend Model signal changes on the major indexes and sector ETFs in the DP Alert Daily Report found in the DP Reports Blog. An excerpt of the report is below showing the XLK signal change:
DECISIONPOINT ALERT DAILY REPORT
Thursday, 1/29/2015

************************ DECISIONPOINT MARKET POSTURE *************************************

The following is the market posture suggested by our mechanical trend-
following tools. These are not trading recommendations, rather they are price
activity flags that should be qualified by chart analysis. The Trend Model is
used on all indexes.


                                     Days   Index     01/29   Points  Percent   Prev Signal
Index               Posture     Date Elap  @Start     Close      P/L      P/L     P/L  Days
------------------- ------- -------- ---- -------   -------  -------  ------- ------- -----
Materials EWt (RTM)     BUY 01/23/15    6    83.59    83.16    -0.43    -0.5%
Technology    (XLK) Neutral 01/29/15    0    40.40    40.40 * Changed Today *   +0.2%    90 <-------
Technolgy EWt (RYT)     BUY 11/04/14   86    87.04    87.91    +0.87    +1.0%
Utilities     (XLU)     BUY 08/28/14  154    42.24    49.41    +7.17   +17.0%
Utilities EWt (RYU)     BUY 08/20/14  162    71.41    81.25    +9.84   +13.8%
Happy Charting!
Erin


