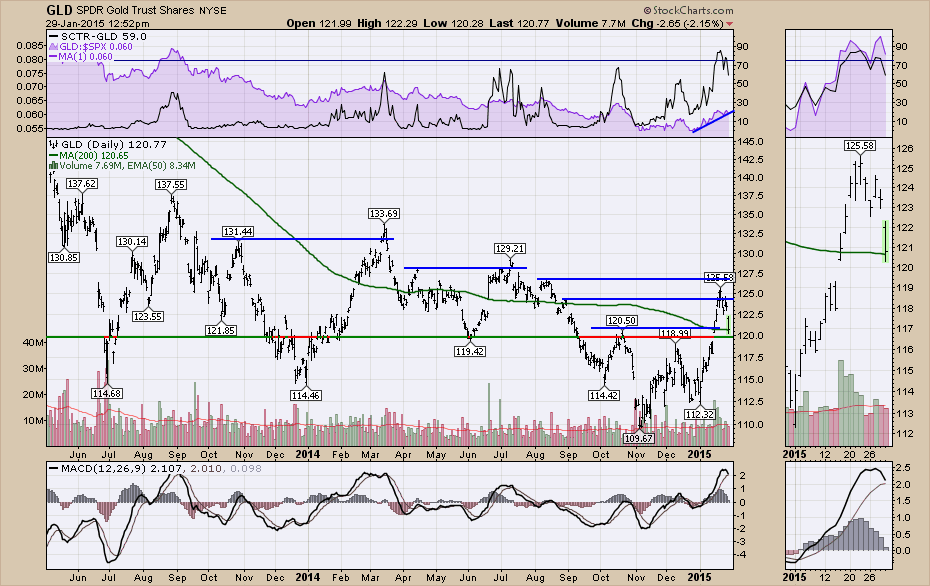
Gold is getting a rough ride the last few days. Today the Gold Tracking ETF (GLD) pulled back to test the 200 DMA. This is typically an important line in the sand. If it can hold here and start to move higher that would be significant. Gold has been very finicky over the last few years. You can see each peak was one day above a previous peak and then it rolled over hard. One exception occurred a few weeks ago with the taking out of October 2014 high of 120.50. GLD just kept marching on. The high recently at 125 was just slightly above the final uptick at the 200 DMA. The region from 125 to 130 has been a real struggle.
Today Gold is testing a major horizontal support / resistance line. I am a believer in the 200 DMA acting as support or resistance. The whole April to September 2014 was a battle along the 200 DMA . We'll find out in the next few days if Gold can get a bounce here. If the $USD was to stop rising that could give GLD the tailwind it might need to break this trend of lower highs. The March push, the July push and this January push all seem to drift above the 200 DMA to get the bulls hopes up, only to be wiped out with severe gaps down. Today's gap lower looks very similar to the March and July peaks in terms of height above the 200 DMA, the vertical surge up, and a gap down ending the trend. The real difference today is the horizontal support resistance line might provide some meaningful help to support the bulls' case right here at the 200 DMA. Decision time.
Good trading,
Greg Schnell, CMT


