The DecisionPoint ultra-short-term indicator suite consists of the Climactic Volume Indicator (CVI), Participation Index (PI) and Net Breadth Indicators. This indicator set exploded with very negative climactic readings today. When we see these "spikes" or "climaxes", we try to determine whether they are initiation or exhaustion climaxes. Based on the shape, the price action preceding the readings and historic data, we can make a hypothesis. I've annotated vertical lines so that you can see when these extreme readings were 'initiation impulses'. Basically, when they arrived, the selling wasn't over, it was starting or continuing. However, you can see that these spikes have signaled a selling exhaustion. In the cases I highlighted, the exhaustions came after an initial set of negative climaxes.
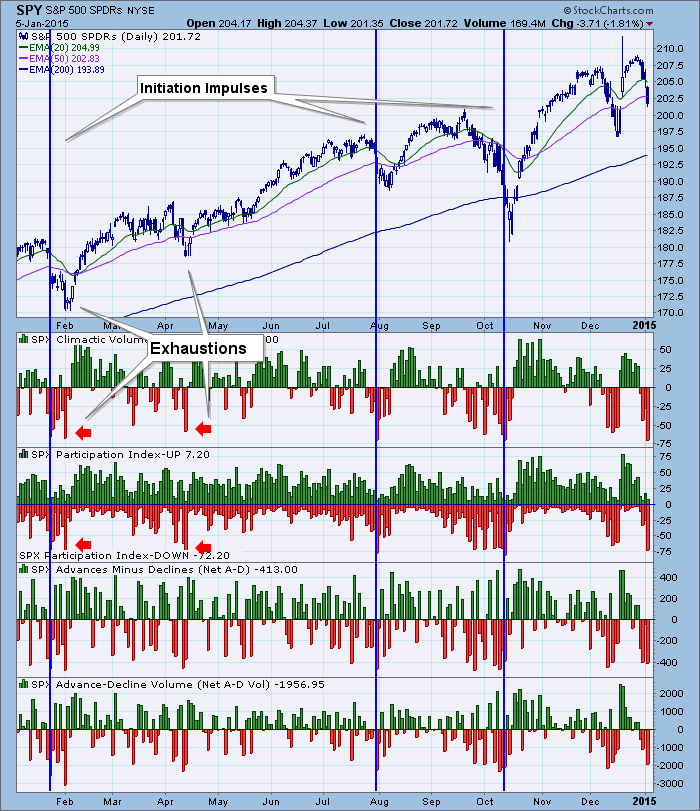
Hypothesis: We are likely seeing an initiation to lower prices in the ultra-short term (typically days). We will now watch this chart for another set of climactic readings that might signal a selling exhaustion.


