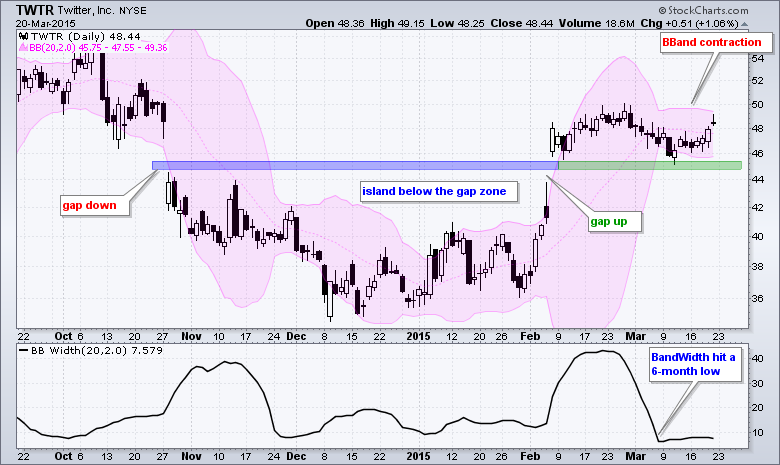
Even though the pattern is a bit big, the gaps fit and it looks like Twitter (TWTR) traced out a large island reversal from late October to early February. The stock gapped below 45, traded below this gap for a few months and then gapped above 45. The result is a price island where shorts are trapped with losses. Anyone shorting the stock below 45 is now trapped with a loss. The blue gap zone turned into support last week as the stock bounced off the 45 area. We have yet, however, to see a continuation of the February surge. Right now the Bollinger Bands are narrowing as volatility contracts, which tells us to prepare for a volatility expansion, or price move. A break above the upper Bollinger Band would be bullish, and a break below the green support zone would be bearish.

Click this image for a live chart


