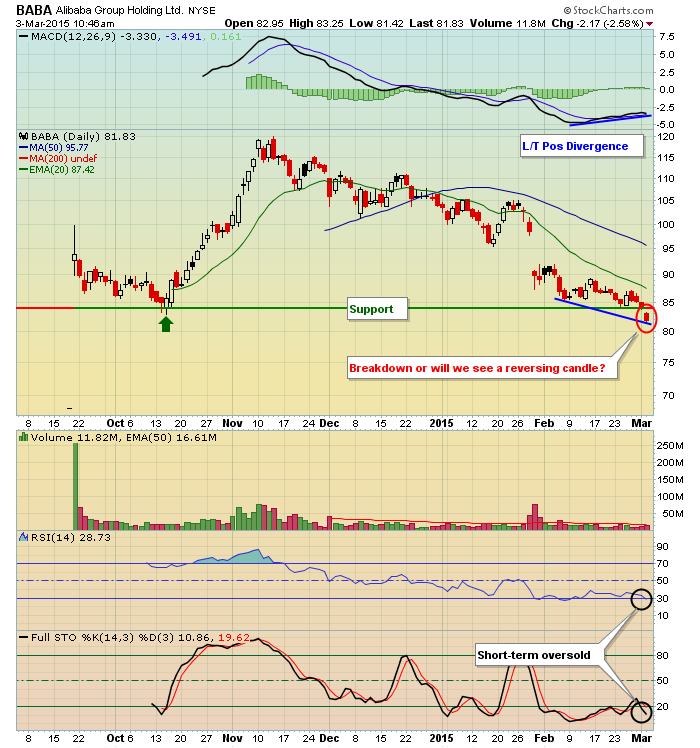
On Monday, BABA closed at 84.00, its lowest close since its IPO in September. However, that close was very close to support and BABA is currently oversold with its RSI below 30 and its stochastic reading at 11. Note there's a long-term positive divergence that's formed on this low, suggesting that downward momentum is slowing. For me, the combination of price and volume trumps all other indicators though. Today's volume is already approaching its 90 day moving average - in just the first 75 minutes of trading. It's important to watch the action here. Why? Because no technical trader in their right mind would buy a stock like this that's breaking down on heavy volume. If we see a reversal later today, it'll likely be due to market makers providing liquidity and committing on the long side. If you need to know one thing about market makers, it's that they generally make money. Given the heavy volume, the long-term positive divergence, the test of price support and the oversold RSI and stochastic, a reversing candle at the close today could become a nice short-term trading opportunity on the long side. Failure to reverse, though, suggests we wait on such a candle before committing. Here's the chart:
Happy trading!
Tom Bowley
