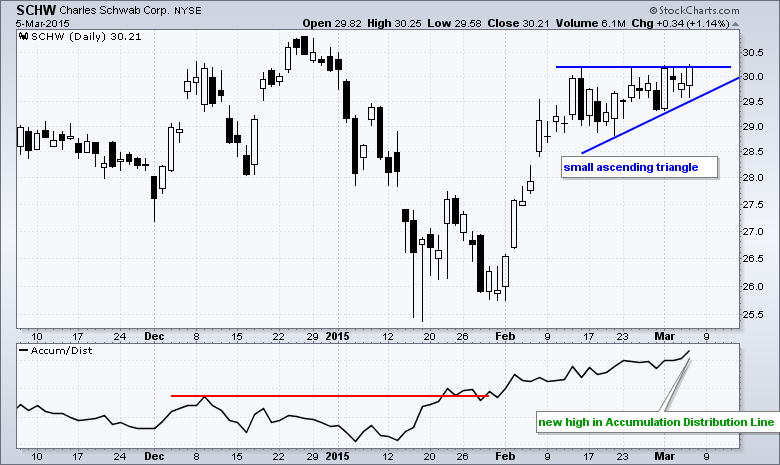
Charles Schwab (SCHW) surged in February and then consolidated the last few weeks with an ascending triangle, which is a bullish continuation pattern. A breakout would signal a continuation of the prior advance and target a move to new highs. The indicator window shows the Accumulation Distribution Line (ACDL) hitting a new high already, and this indicates that stock has been under accumulation during this ascending triangle.
Click this image for a live chart

About the author:
Arthur Hill, CMT, is the Chief Technical Strategist at TrendInvestorPro.com. Focusing predominantly on US equities and ETFs, his systematic approach of identifying trend, finding signals within the trend, and setting key price levels has made him an esteemed market technician. Arthur has written articles for numerous financial publications including Barrons and Stocks & Commodities Magazine. In addition to his Chartered Market Technician (CMT) designation, he holds an MBA from the Cass Business School at City University in London.
Learn More


