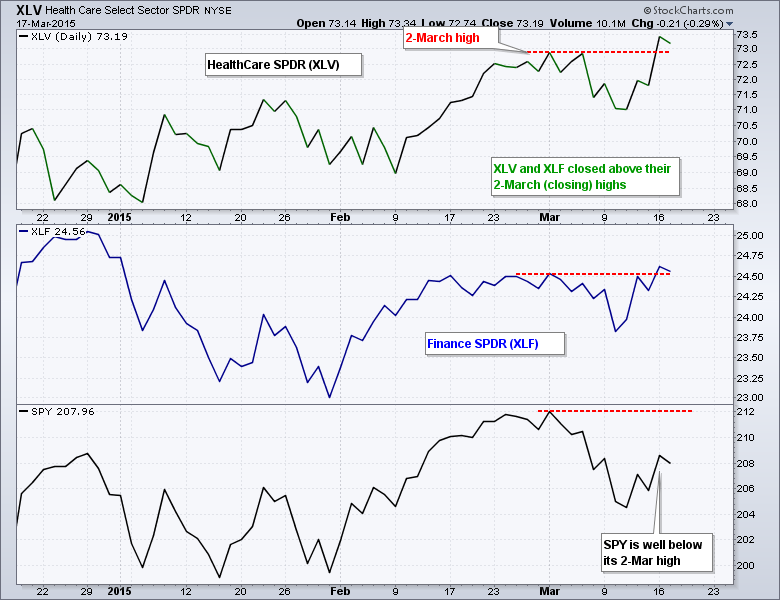
There are several ways to measure relative performance here at StockCharts. Chartists can use ratio charts (XLF:SPY), the StockCharts Technical Rank (SCTR) or Relative Rotation Graphs (RRGs). Chartists can also compare the respective price charts. The chart below shows closing prices for the HealthCare SPDR (XLV), Finance SPDR (XLF) and S&P 500 SPDR (SPY). The red dotted line marks the closing high on March 2nd. Notice that SPY remains well below this high, but XLV and XLF closed above this high on Monday and Tuesday. These are the only two sector SPDRs trading above their March 2nd highs and this is a form of relative strength.
Click this image for a live chart

About the author:
Arthur Hill, CMT, is the Chief Technical Strategist at TrendInvestorPro.com. Focusing predominantly on US equities and ETFs, his systematic approach of identifying trend, finding signals within the trend, and setting key price levels has made him an esteemed market technician. Arthur has written articles for numerous financial publications including Barrons and Stocks & Commodities Magazine. In addition to his Chartered Market Technician (CMT) designation, he holds an MBA from the Cass Business School at City University in London.
Learn More


