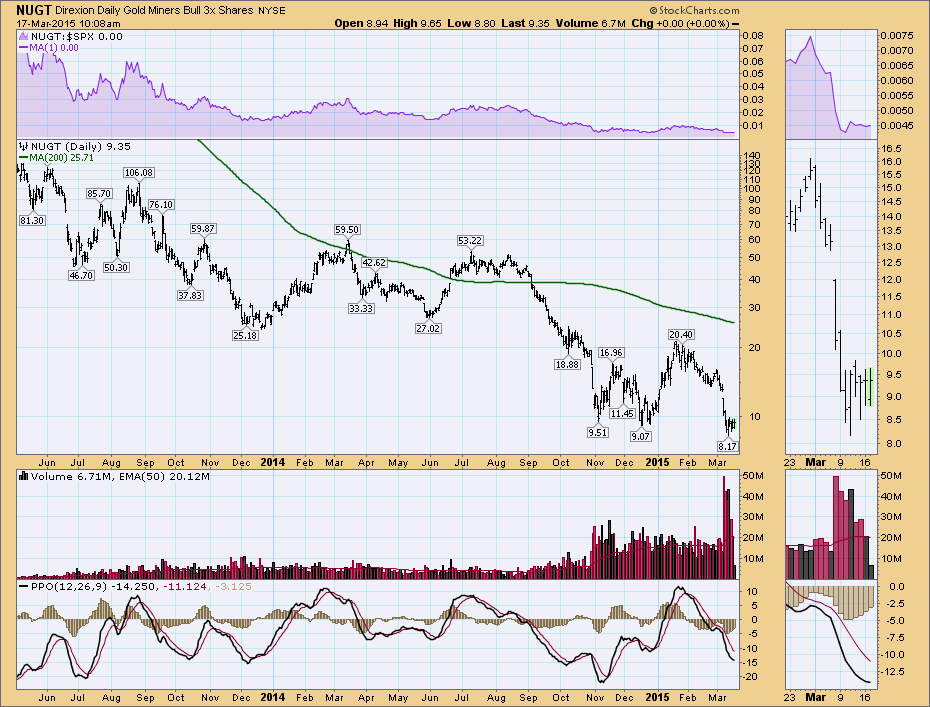
While we don't usually use triple ETF's for the 'Don't Ignore This Chart' blog, the clues on this NUGT chart are applicable to all gold traders.
There are a certain group of traders that trade the 3x ETF's. While I don't trade the triples, this active trader crowd can offer clues to potential trend changes. This week is a good example. I want to zoom in on the volume graph. As the miners drilled lower in late October, the volume exploded on the chart, indicating traders were starting to expect some upside. Their timing was pretty good with a 60% gain in 3 weeks. The volume soared from 10 to 20 Million shares / day. Then in December the volume picked back up again from 15 Million shares/day to 20 Million shares/day and the price doubled.
Last week, the volume exploded to 50 Million shares/day and spent the whole week above the previous high water level. On the actual GDX chart (click to view) the price basket is still above support and the volume signature is not nearly as obvious. NUGT, the 3x ETF, is hovering at or below support with a very clear volume signature. The reason I think this might be a chart to pay attention to is where there is this much smoke, there is usually fire. With 200 Million shares on the week, its important to remember one primary cornerstone of Technical Analysis is volume precedes price. A chart that glitters might be worth some attention even if you choose to use another ticker symbol for your trade. Perhaps that St. Patricks Day Pot O' Gold will be coming your way.
Good trading,
Greg Schnell, CMT

