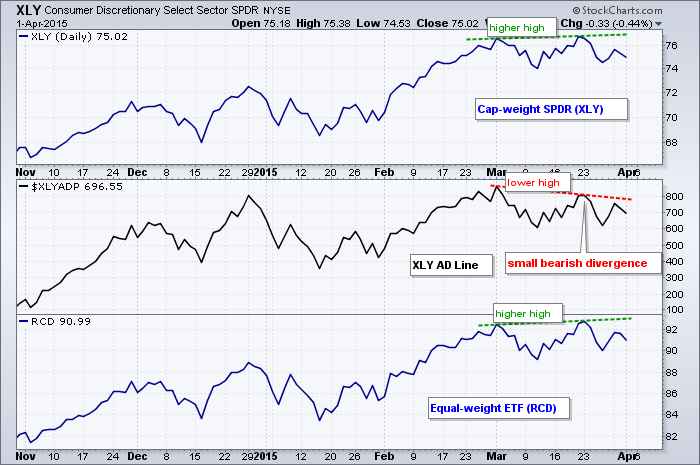
The Consumer Discretionary SPDR (XLY) is perhaps the single most important sector in the stock market because it is the most economically sensitive sector. Industry groups in this sector include retail, restaurants, autos, media and home construction. XLY is weighted by market cap and reflects the performance of the large-caps in the sector. The Equal-Weight Consumer Discretionary ETF (RCD), in contrast, is equally weighted and more representative of the sector as a whole.
Chartists can also use the XLY AD Line ($XLYADP) to analyze breadth for the sector. Also known as internals, breadth indicators are like looking under the hood to see how the engine is running. The AD Line is a cumulative measure of AD Percent, which is advances less declines divided by total issues. An advance counts +1 and a decline counts -1, regardless of market cap. This means Disney (DIS), which has a market cap of $177 billion, counts the same as Fossil (FOSL), which has a market cap of just $4 billion.
The chart above shows the Consumer Discretionary SPDR, the XLY AD Line and the Equal-Weight Consumer Discretionary ETF. Notice that XLY and RCD formed higher highs over the last five weeks. In contrast, the XLY AD Line formed a lower high and breadth did not keep pace. This small bearish divergence indicates that participation in the advance is narrowing and is something we should watch going forward.

