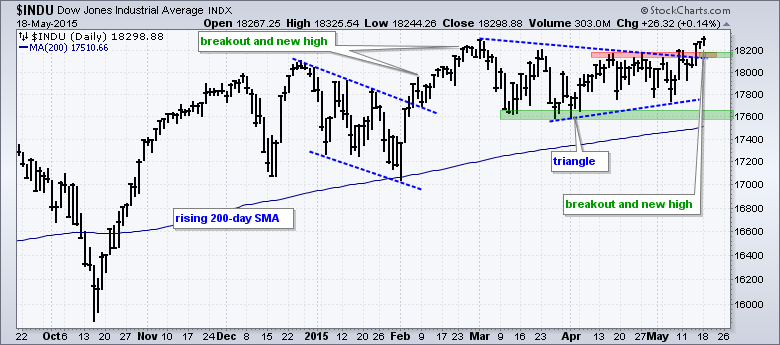
The S&P 500 hit a new high last week and the Dow Industrials followed suit with a new high this week. Overall, the Dow broke triangle resistance with a surge on Thursday and this breakout signals a continuation of the current uptrend. Broken resistance turns first support to watch. A strong breakout should hold and a quick move back below 18000 would show cold feet. The March-April lows mark key support in the 17600 area. The triangle is around 700 points high (18300 to 17600). Chartists can add this distance to the breakout zone for a rough estimate of an upside target (18150 + 700 = 18850).
Click this image for a live chart.

About the author:
Arthur Hill, CMT, is the Chief Technical Strategist at TrendInvestorPro.com. Focusing predominantly on US equities and ETFs, his systematic approach of identifying trend, finding signals within the trend, and setting key price levels has made him an esteemed market technician. Arthur has written articles for numerous financial publications including Barrons and Stocks & Commodities Magazine. In addition to his Chartered Market Technician (CMT) designation, he holds an MBA from the Cass Business School at City University in London.
Learn More