Johnson & Johnson (JNJ) had a great day on Monday. However, on the chart, JNJ had some meaningful technical signals. Starting at the top in purple, The relative strength is turning to the upside after being in a downward trend. It is at 1 month highs and the .49 level on the left scale would be a three month high. Reading the legend, you can see we are right at the 3 month highs. The SCTR is very weak, shown in black, with the stock behaving better than 37% of the companies. However, there is a long downtrend on the SCTR, and you can see the down trend is clearly broken. I overlay these two indicators to save vertical space. You can click on the chart and separate them.
On the price chart, the stock jumped above the 4 month highs shown with the gold line and also jumped above the 200 DMA. We can see this price level at the gold line is an important support resistance level.
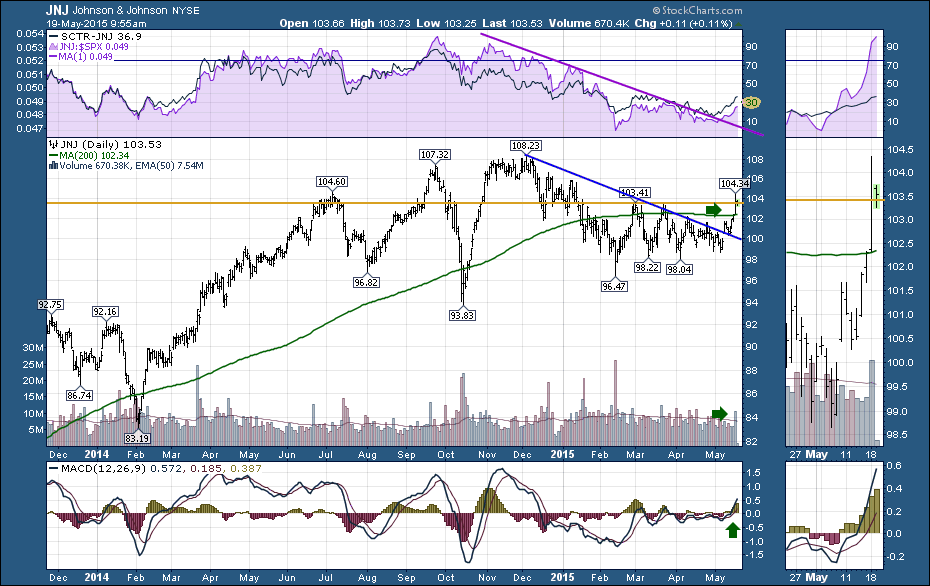
The volume was well above average and the MACD is surging. The bottom line is this one year consolidation in JNJ seems to be building strength for a new push. The rising lows from February look very good. The 200 DMA marks support at 102. If that fails to hold, it would be a failed breakout.
Good trading,
Greg Schnell, CMT
