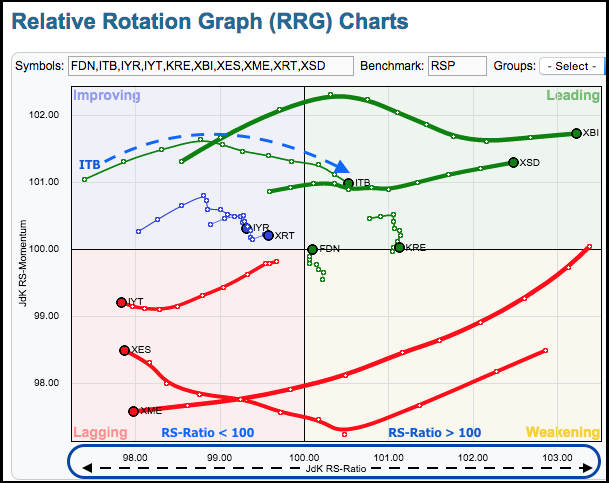
The Home Construction iShares (ITB) is showing some improvement in relative performance with a move from the improving quadrant to the leading quadrant over the last few days. The image below shows a daily Relative Rotation Graph (RRG) with ten industry group ETFs and the Equal-Weight S&P 500 ETF (RSP) as the benchmark. In addition to the four quadrants the RRG can be divided into two halves. Symbols on the left show relative weakness because their JdK RS-Ratio is below 100. Symbols on the right show relative strength because their JdK RS-Ratio is above 100 (see scale at bottom). ITB recently crossed from the left half to the right half and became a leader (blue dotted line). Relative strength sometimes precedes absolute strength so chartists should watch the actual price chart for a potential breakout.

Click this image for a live chart
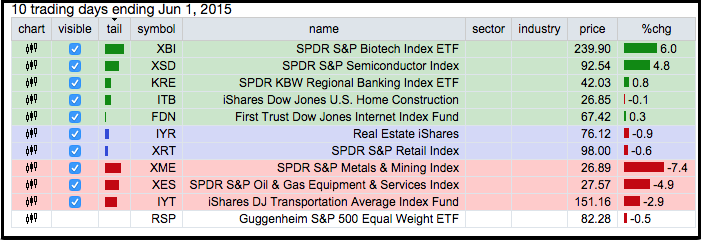
It is little surprise that the Biotech SPDR (XBI) and Semiconductor SPDR (XSD) are the leading groups because both are near 52-week highs. These two symbols are the furthest right on the RRG and at the top of the table (see below). We are seeing some relative strength in the Regional Bank SPDR (KRE) and the Internet ETF (FDN) because both are still on the right side. The Metals & Mining SPDR (XME), Oil & Gas Equip & Services SPDR (XES) and Transport iShares (IYT) are the big laggards and all three are to the far left. You can read more about RRGs in our ChartSchool article.

Click this image for a live chart


