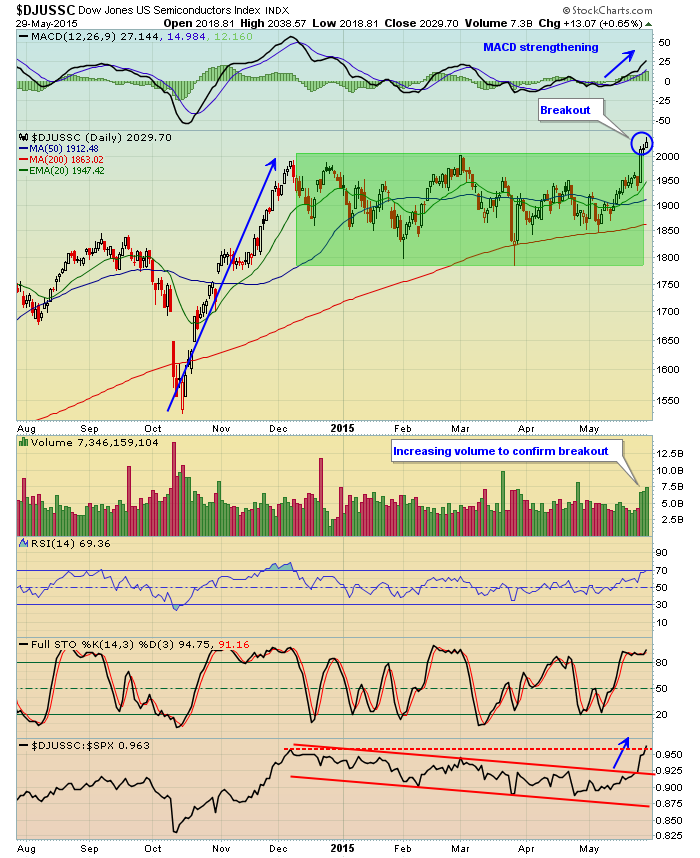
Just a couple days after finally clearing two month resistance at 1950, the Dow Jones U.S. Semiconductor Index closed above 2000 for the first time in 14 years late last week. Semiconductors tend to move quickly in both directions so given the breakout, I'd be looking for further appreciation in the near-term. Previous highs in December 2014 and March 2015 had marked resistance over the past six months while lows in February and March had marked support. This rectangular consolidation followed a sharp rise in October and November of 2014. The daily MACD is now pointing straight higher, which is indicative of strengthening momentum and the volume that accompanied last week's breakout was strong. Note also at the bottom of the chart that semiconductors have also broken out on a relative basis vs. the S&P 500. Check it out:
Happy trading!
Tom