Bank of America (BAC) has been a wild ride for swing traders. The faster ones will have made some money. The slower ones will have been stopped out both directions, time after time. The Buy and Holders have been worked over on their conviction. $16.75 has been a very interesting reversal point for Bank of America. As you can tell by the chart, the price has oscillated around this level many many times over the last 18 months. There have been many breakouts to the upside on news that the Fed would raise interest rates. This would help B of A. But the stock keeps pulling back. Could this be the final breakout and a surge to new highs here? The stock gets lots of attention in the news media almost every week. Sitting in the middle of its trading range, it hardly feels like a breakout. However, the stock accelerated to 5 month highs on Wednesday and continued to pusher higher intraday today. The SCTR ranking is back up to 70%. Using $16.75 as a pivot, I like it above the level.
If BAC can get above 75% on the SCTR, that could get more than a few investors starting to notice the relative price action. A stop at $16.75 is recommended but four of the dips pulled back to $16.50.
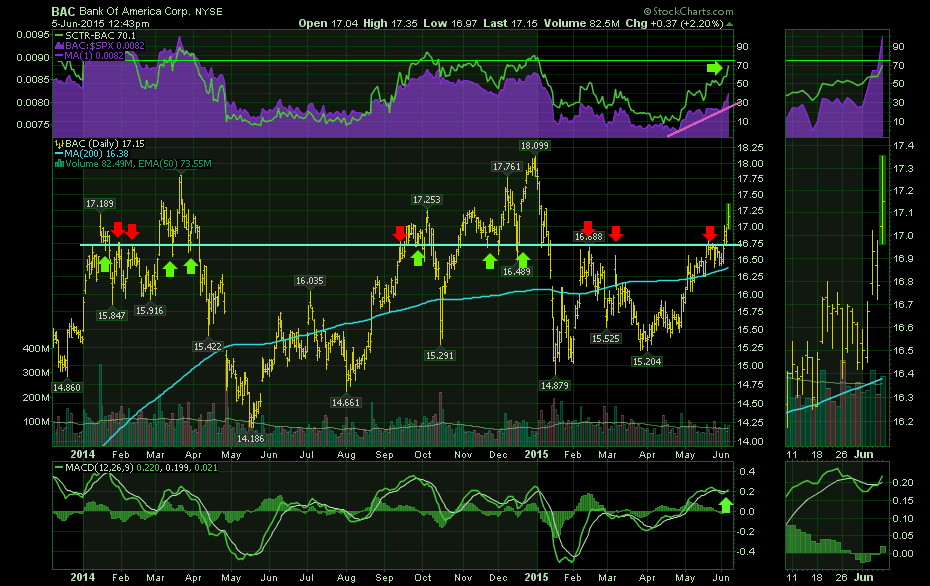
A surging MACD turning up here is very bullish and the consensus seems to be building for an interest rate hike by the Fed. With that backdrop maybe BAC can keep hiking to higher ground.
Good trading,
Greg Schnell, CMT


