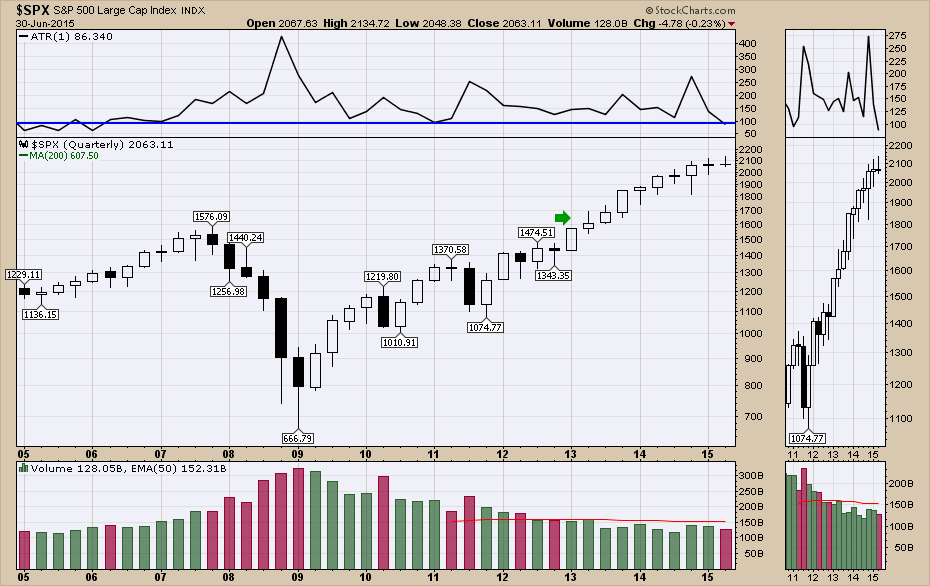
The $SPX has been moving in a tight range for the last six months. In December 2014 we closed at 2059, in March 2015 we closed at 2067, in June we closed at 2063. Quarterly data can take a lot of the weekly machinations of the market and make it look more normal. So the chart below shows a steady advance over the last 3 years with the close of every candle inside or above the body of the previous candle. Nicely defined uptrend. In one year we have moved from 1960 to 2063 so 5% over a 1 year span. More interesting for me is that the price range (ATR) in the quarter was the smallest range going all the way back to March of 2006 or 10 years ago. Interestingly enough, the March of 2006 was actually a rise in volatility from lower levels in 2005. The real difference here being the percentage change was a lot smaller as the basis is 2000 now not 1300. The green arrow points to the most recent long candle wick compared to the current one. This just shows how far down we closed from the high of the quarter. The bottom line is it was not extreme. Lastly, the volume continues to decline with 2 years of a declining 5 quarter average.
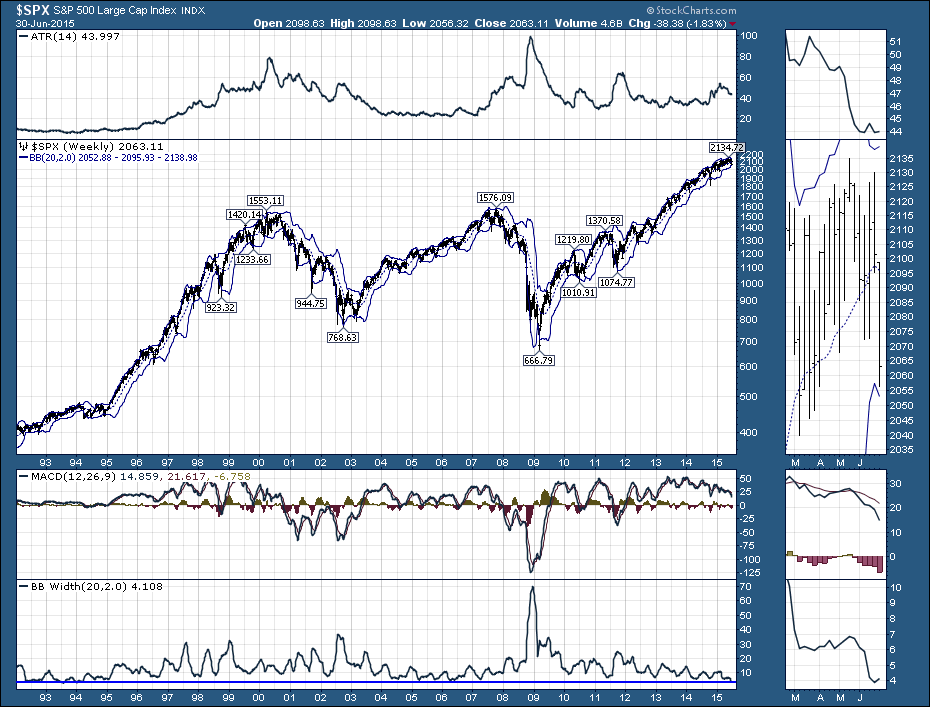
If you look at the Bollinger Band Width (bottom pane on a weekly chart below), the last time the range was this small was 1994 when the $SPX was at 477. Usually a pinching of the Bollinger Bands is associated with the calm before the storm. In 1994 it marked a sideways market that broke out to the upside for a 5 year run. Can it do the same now? We'll watch closely, but a low quarterly range, accompanied by the low weekly Bollinger Band reading suggests a market in search of direction. We also have the lowest MACD level in two years with declining momentum so it's a great time to pay attention to the underlying signals in the market.
The answer to the question in the title is down four points on the quarter and up four points on the year to date. Middle of the range but a ticket to some upcoming changes in volatility.
To all the Canadian investors out there, Happy Canada Day!
Good trading,
Greg Schnell, CMT


