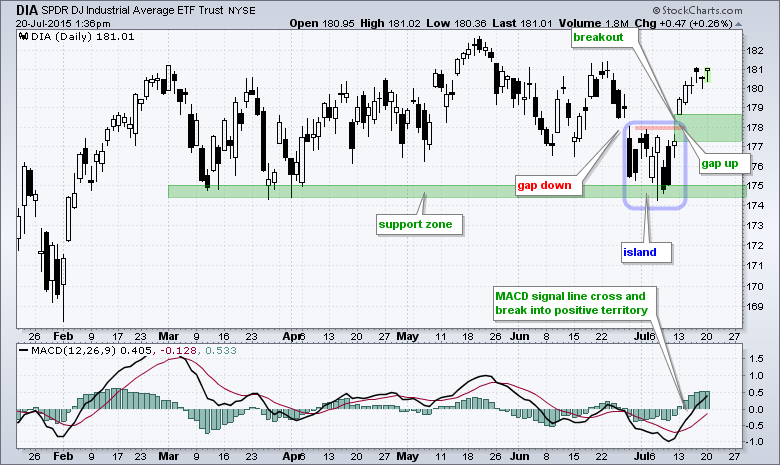
With a gap and big surge, the Dow Diamonds (DIA) triggered a series of bullish signals that remain valid until proven otherwise. First, let's look at the bullish signals. DIA bounced off support in the 174-175 area in early July and broke resistance with a surge above 178. Also notice that an island reversal formed as DIA gapped below 178.2 on 29-Jun and then gapped above this level on 13-Jul. The resulting gaps created an island where bears (short-sellers) are trapped with losses. Momentum also turned bullish as MACD moved above its signal line and turned positive.
Click this image for a live chart
So what would it take to prove these bullish signals otherwise? First and foremost, the gap and breakout are bullish as long as they hold. A close below 177 would fill this gap and negate the breakout. Such a failure would call for a reassessment. Second, momentum has a clear upward bias as long as MACD remains positive. A MACD cross into negative territory would be bearish. Note that I am not worried about low volume because volume is supposed to be low in summer. Price action is first and foremost, and the gap is bullish until proven otherwise.


