Anyone who had doubted Google (GOOGL) and their ability to make money got routed to the Pocket of Pain in today's trading. Google surged 25% in trading and was up $140 from Thursday's close. This massive ramp up is clearly a house cleaning for all those caught shorting Google. But the question now is what to do with Google? Let's look at the chart.
The SCTR shows Google climbing from 60 to 99 this month. That is a big move. Notice that the SCTR has never been above 75 for the last 5 quarters. That level of average performance also created indifference towards owning the stock. It was only up 5% immediately in after hours action on the release of earnings last night but got bid up as institutional investors continued to buy the stock all day today. We can see the sideways consolidation on Google from January 2014 to now. However, today was a serious game changer. Breaking out of the consolidation and moving to all time highs is very bullish. The extreme level it is at in terms of short term momentum suggests this will probably go higher.
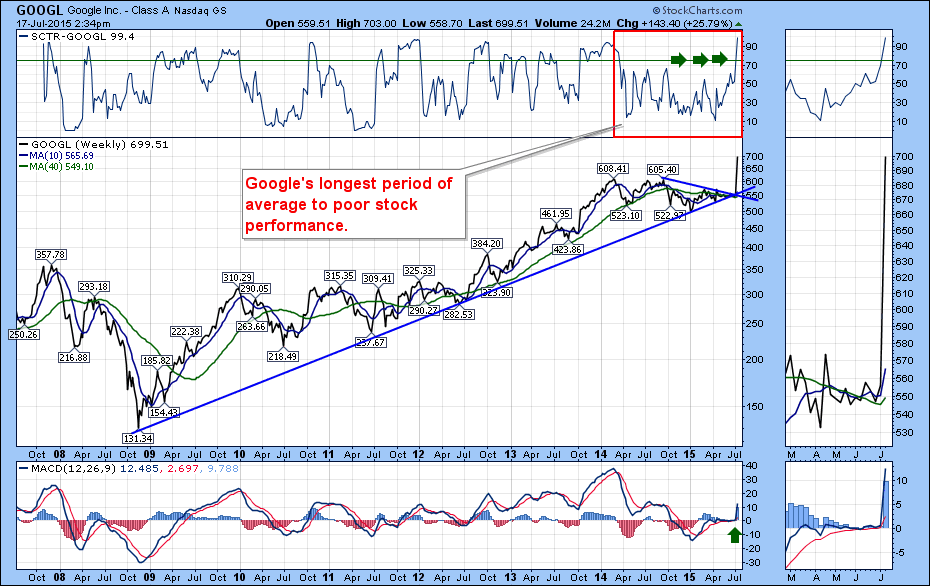
The MACD made a ballistic move higher as well. This looks like a good kickoff rally to start the next leg higher. After the emotional surge today, a small pullback to $680 might be in order. This wasn't day traders flipping in and out of the stock. This was the footprint of institutional investors climbing on board. For other examples of large cap Tech gapping higher, see Amazon at the end of January 2015, Apple in April 2014 and Netflix in January 2015. Click on the links to see Amazon, Apple and Netflix. When institutions move into the stock with conviction, it can be powerful. Every case is different so we can't be guaranteed. I would suggest if the overall market holds up, Google should go a lot higher. Place your trade accordingly to your risk tolerance, but this looks ready to run.
Good trading,
Greg Schnell, CMT


