The Japanese Yen ($XJY) gapped above resistance and the major down trend that has been in place for years. The real question is if this is a interim low in the Yen or a much more important low.
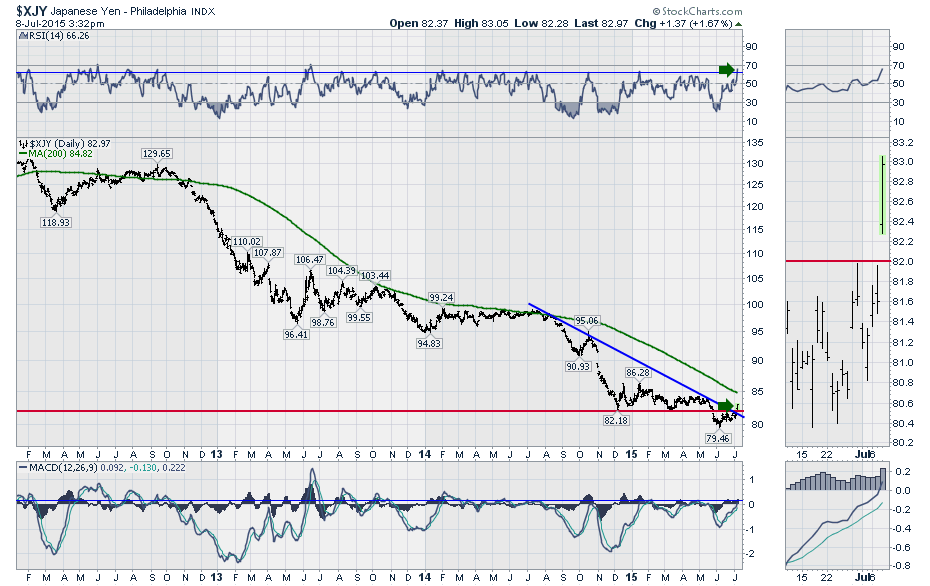
The last time the RSI got this strong was back in 2013 and that ended up being a whipsaw or false breakout. Moving to price, the giant slide in value for the Yen created a massive downtrend which only created one higher high occurring in 2013. The price gapped up above the red line resistance today. The blue downtrend which has been going on for a year was also broken on the same move. The level of 85 is very important now. A meaningful push above 85 would force a change in a lot of carry trades and would probably force short Yen trades to cover, pushing the Yen higher. A higher Yen is usually bearish for the NIKKEI stock Index. So while we have broken the first level of horizontal resistance and the downtrend, the 85 level would be a new 5 month high for the first time since 2012. Notice the blue line on the MACD. If we get a change in momentum towards the Yen, this is an important parameter in the global market structure.
Good trading,
Greg Schnell, CMT


