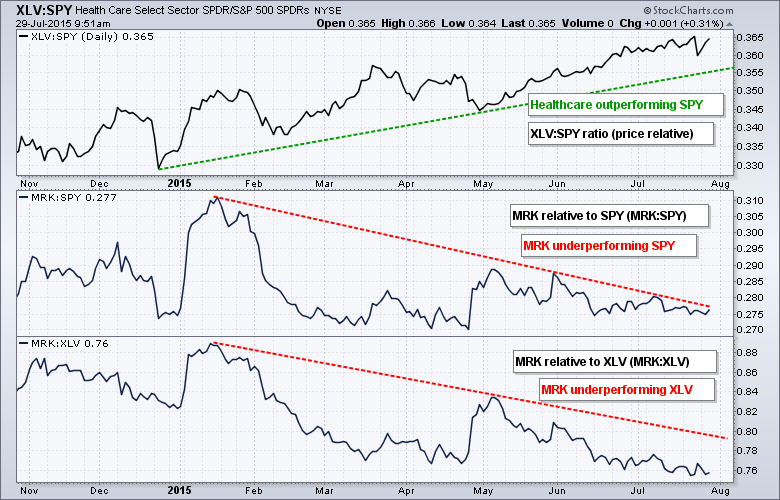
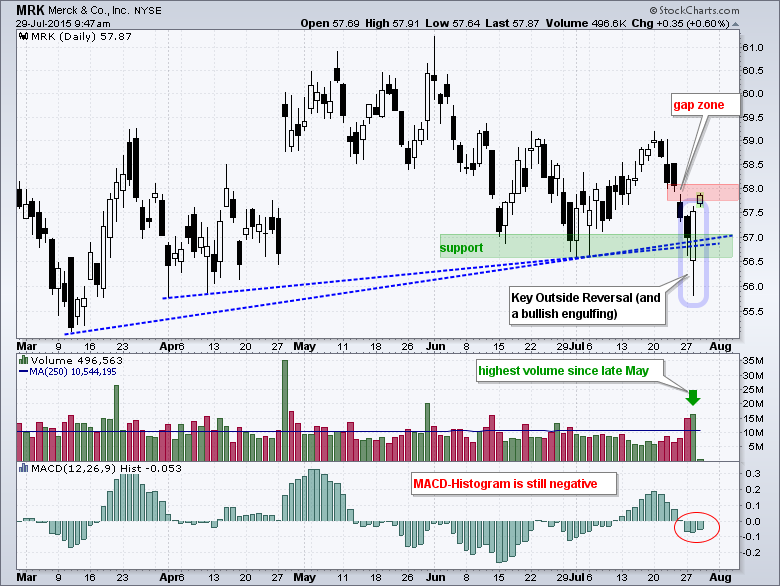
The HealthCare SPDR (XLV) has been one of the strongest sectors in 2015, but Merck (MRK) has lagged both the market and the sector. The first chart shows the HealthCare SPDR (XLV) relative to the S&P 500 SPDR (SPY) using the price relative (XLV:SPY ratio). This ratio has been rising since late December and this means XLV is outperforming SPY (the market). The middle window shows Merck relative to SPY (MRK:SPY ratio) and the lower window shows Merck relative to XLV (MRK:XLV ratio). Both ratios are falling and this means Merck is underperforming the market and its sector. Despite relative weakness, the stock is showing signs of strength at support and could be poised to bounce (second chart after the jump).

Click this image for a live chart
The second chart shows Merck hitting support and then forming a large bullish engulfing pattern. In addition, notice how the stock opened below the prior low and closed above the prior high. Tuesday's price action was also an outside day. Taken together, we have a key outside reversal (open below prior low and close above prior high). This price action reinforces support and increases the chances of a bounce from current levels. Also notice that it occurred on high volume. A key outside reversal is just one day so a little follow through would further reinforce the reversal. A close above 58.2 would fill the gap zone and show follow through. Chartists can also watch the MACD Histogram for a move into positive territory. This would signal that MACD has moved above its signal line.

Click this image for a live chart
