I have been reading with much interest how the potential slowdown in China will be the next reason why the S&P 500 will tumble. But by changing a few chart settings here at StockCharts.com, you can quickly visualize the correlation between the Chinese stock market and our own here in the U.S. To be quite honest, there's been a history of little correlation between our two markets although recently the correlation has been more positive. The correlation indicator ranges from +1 (strong correlation) to -1 (weak correlation). Note from the chart below that the U.S. and China markets have swung back and forth wildly over the past 20 years in terms of correlation. They will sometimes move together, but many other times move opposite one another. At the bottom of the chart, however, I've provided the correlation between the S&P 500 and the German DAX. We have seen a very strong positive correlation between these two indices telling us that what's going on in Europe has a much bigger impact to the U.S. than what's happening in China. In the future that could change, but this chart doesn't lie. Take a look:
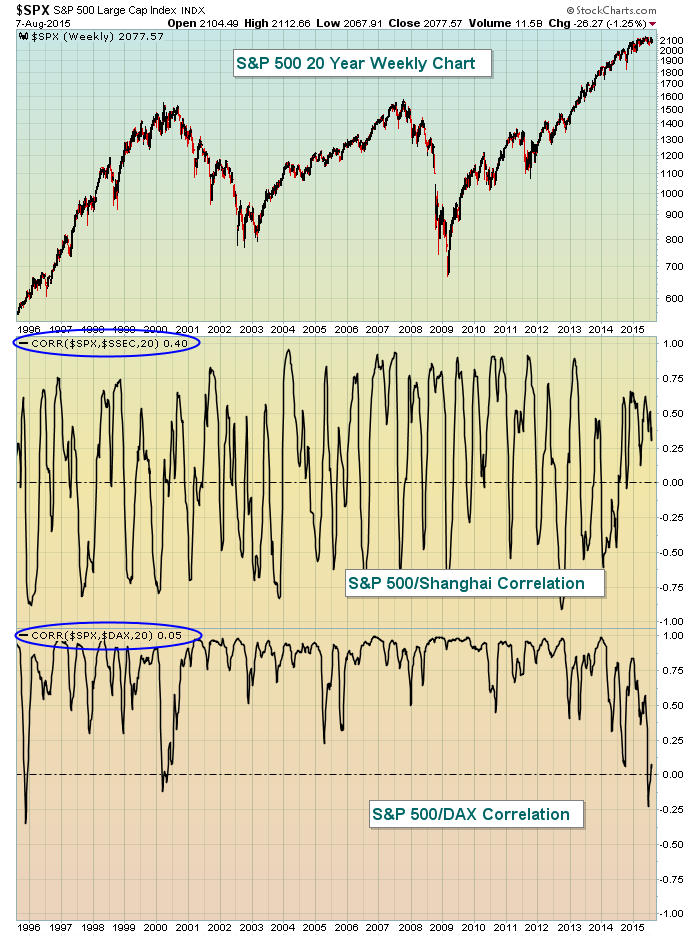
The fact that the correlation factor remains almost exclusively above 0 and generally very close to 1 between the U.S. and Germany suggests that we need to continue to focus on economic activity in Europe.
Happy trading!
Tom


