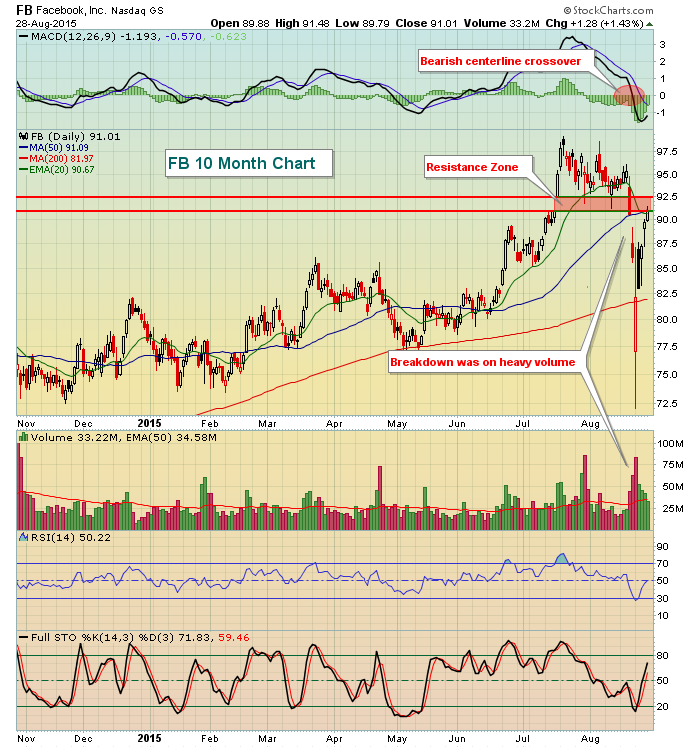
Facebook (FB), like so many internet stocks, performs its best during the month of September. There's not much of a sample size with FB since it went public just a little more than 3 years ago. However, during its last 3 Septembers, FB has averaged gaining 15.7% during the month and this seasonality strength is supported by the fact that the Dow Jones U.S. Internet Index ($DJUSNS) is the best performing industry group in September over the last 15 years, with an average September gain of nearly 5%. The only month that internet stocks perform better than September is October so the next 60 days will find historical tailwinds supporting the internet bulls. Technically, FB is up against very significant resistance in the form of gap resistance, a couple levels of price resistance and it's testing both its 20 day EMA and 50 day SMA from underneath on its recovery attempt. Stocks with high volume selloffs typically struggle as they near that falling 20 day EMA, especially with its daily MACD now beneath centerline support. This resistance zone won't guarantee FB is heading lower, but failure to clear it will make its September historical strength a moot point. From the chart below, the 90.50-92.50 resistance is formidable and that's where FB finished on Friday. Check it out:
Happy trading!
Tom


