Stocks opened weak, plunged after the open and then recovered around midday. The Dow dipped below 15500 in the morning and then moved back to the 16200 area by noon ET. The opening gap, deep dip and recovery mean that several stocks could form big hammers today. These are short-term candlestick reversal patterns that form with a small body at the top of the high-low range. The example below shows Pfizer (PFE) with an opening gap below 33, a morning dip below 29 and a current price near 32.90. The body of the candlestick represents the open-close range. It is hollow because the current price is above the open, but the candle is red because the current price is still below the prior close. The candlestick represents a big intraday reversal, but the stock still needs to fill the gap in the 33-33.5 area to negate the support break. Note that the predefined scans page is full of hammers. A screen shot and link are provided after the jump.
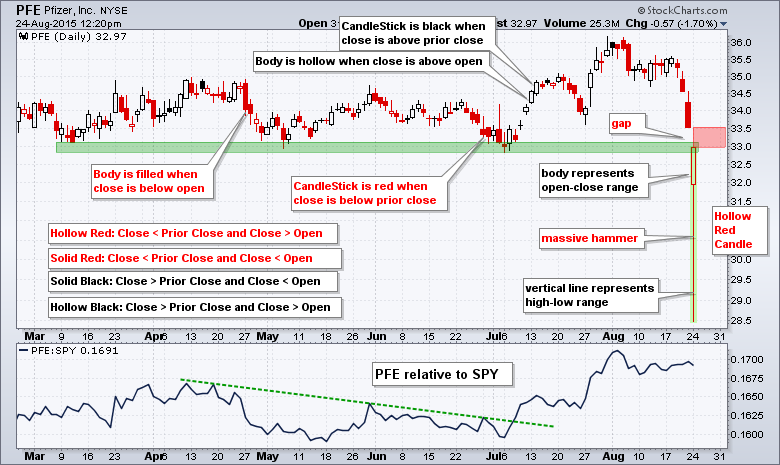
Click this image for a live chart
Hammer Scan Results (click here)
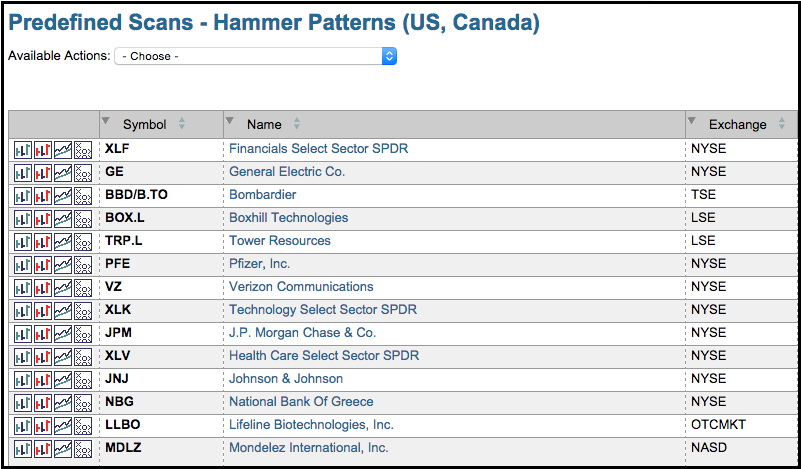
Click this image for a live scan.
