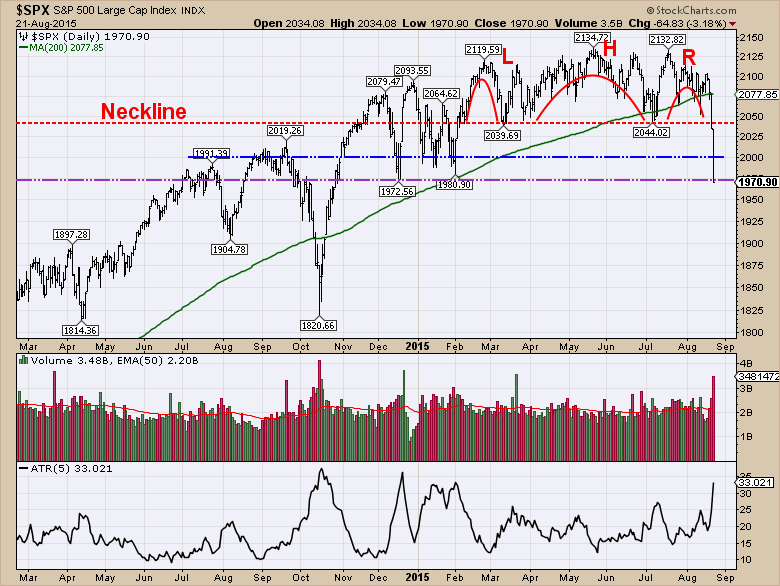
The selling was broad based across the market today. This market had a lot of issues regarding the number of stocks holding the market up. With breadth thinning every week, it appeared to be a matter of time before the market would have a larger pullback. The size of the intraday move yesterday and today indicates that the large institutions were selling this pull back.
While this chart may bounce off support on Monday, the three lines above the current level will be important tests of resistance. The 2000 level was a good support/resistance level on the way up. How important that level is on the way down will be important. We cut through it like a hot knife through butter today, but it may become an area where we oscillate around.
The next level would be the 2040 level which used to be support for the last 6 months. It is not uncommon for a break of a Head/shoulders topping pattern to have a rally back up to the neckline which is the red dotted line.
Lastly is the 2077 level which is the 200 DMA. The 200 DMA is now a bounce of 100 points which will be an extreme test of market resiliency if there is no market encouragement from central banks.
There will be lots of commentary on the website this weekend including Chip Anderson and Greg Morris doing a webinar tomorrow morning. That should be very interesting. I would encourage everyone to scroll through the webinar archives, the recent blogs and the blog articles that have been written over the last month by using the drop down menu on the right hand side to select the individual blog.
Good trading,
Greg Schnell, CMT


