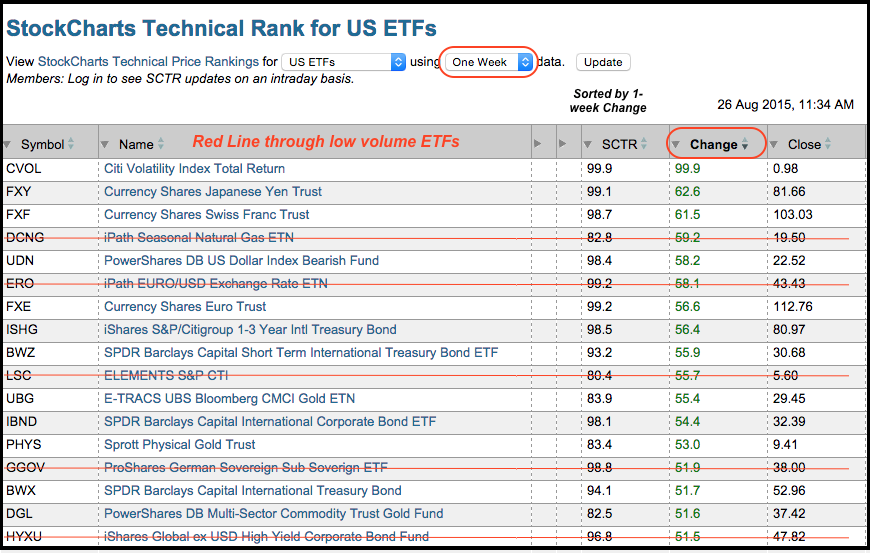
There has been a big changing of the guard over the last few weeks as stock alternatives gained in relative rankings. The table below shows the StockCharts Technical Rank (SCTR) for our ETF universe, which excludes inverse and leveraged ETFs. It is sorted by the one-week change for the SCTR. I took the liberty of drawing a red line through some of the low volume ETFs. Even though these are ETFs, the leadership group is sending a clear message. Stocks went out of favor. Volatility, some currencies, bonds and gold moved in to favor. Volatility spiked and I will show a chart for the Citi Volatility Index Total Return ETN (CVOL) after the jump.
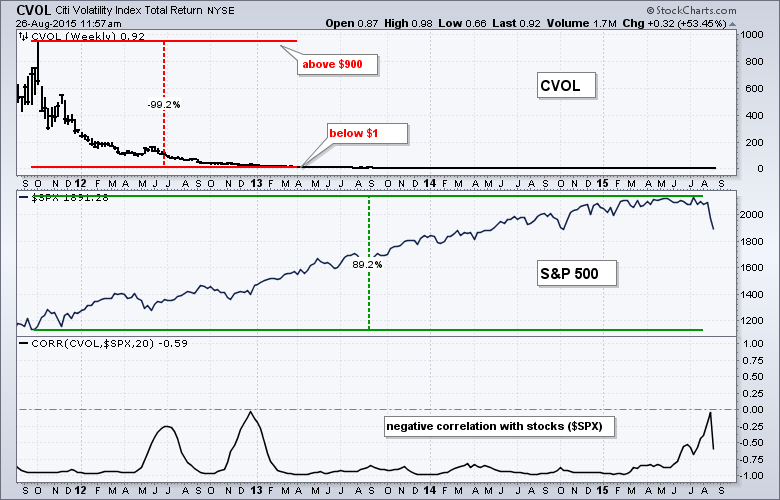
The chart below shows the Citi Volatility Index Total Return ETN (CVOL) peaking above 900 in October 2011 and then falling below 1 this year. This ETF declined steadily as the market rose, which reflects the normal relationship between the S&P 500 and the S&P 500 Volatility Index ($VIX). Chartists can quantify this inverse relationship with the Correlation Coefficient ($SPX,CVOL). It has been below zero for four years.
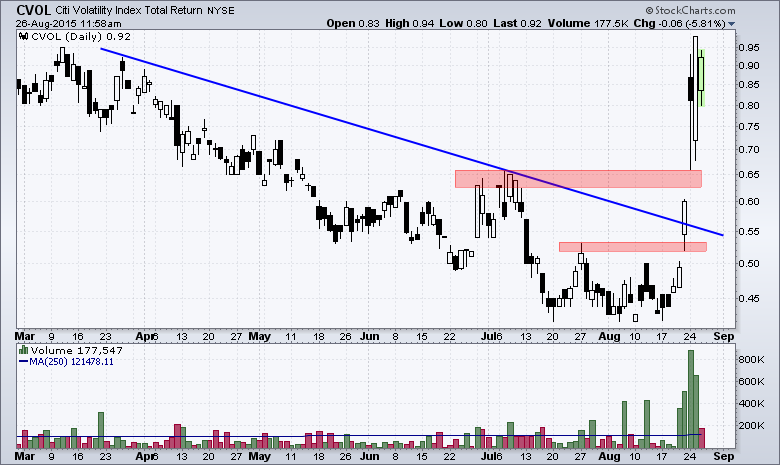
Over three years of falling volatility gave way to a big surge in volatility over the last six days. Notice that CVOL surged from 45 cents to 90 cents and doubled. There are clear breakouts as well on the chart and it looks like an uptrend has started. This uptrend, however, is totally dependent on the downtrend in the S&P 500. Further weakness in the index and more downside volatility would be bullish for CVOL. A rebound in the S&P 500 or consolidation would weigh on CVOL and it could easily lose half its value. I would suggest that chartists check out the C-Tracks website for details on CVOL before considering a position.
Thanks for tuning in and have a great day!
-- Arthur Hill CMT


