While we cannot rule out the possibility of a sustained advance to clear technical hurdles, the first attempt today was an epic fail at or just below a critical short-term resistance zone. Given the high volume selling over the past 7-10 days and loss of key price support levels and MACD centerline support, the first critical test - in my opinion - is the area of price resistance and the falling 20 day EMA. In the case of the NASDAQ, key gap resistance resides at 4800, while price resistance is closer to 4900 and the now-declining 20 day EMA just below 4900. We've seen a very strong rally off Monday's open - the NASDAQ was up more than 10% from that open - but it's reversed lower this afternoon after moving into that 4800-4900 resistance zone. Take a look:
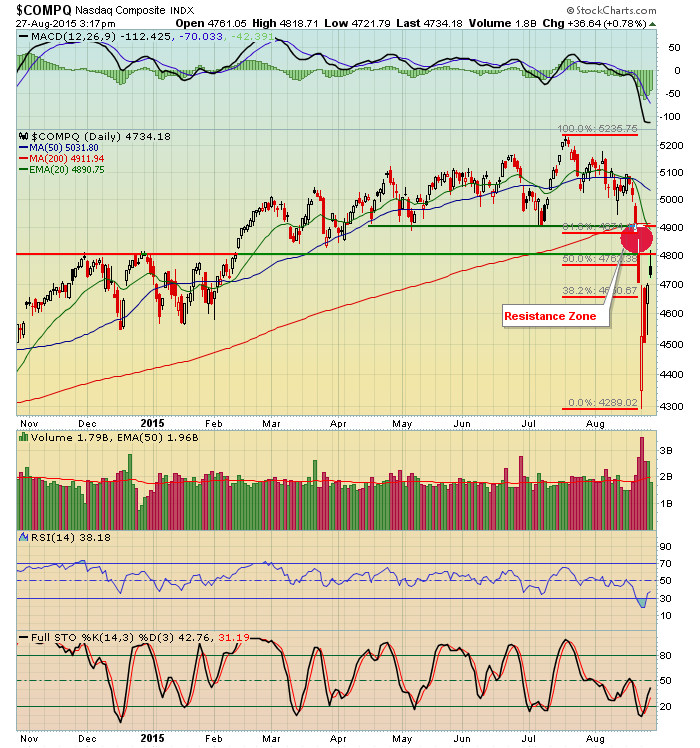
Note also that the key Fibonacci retracement levels of 50% and 61.8% fall in approximately the same resistance area as well. The bulls are going to need to pack a punch to clear this zone. In the meantime, it would seem prudent to use this area to capture short-term trading profits (or to short for those who have that bias) until the market tells us otherwise.
Happy trading!
Tom


