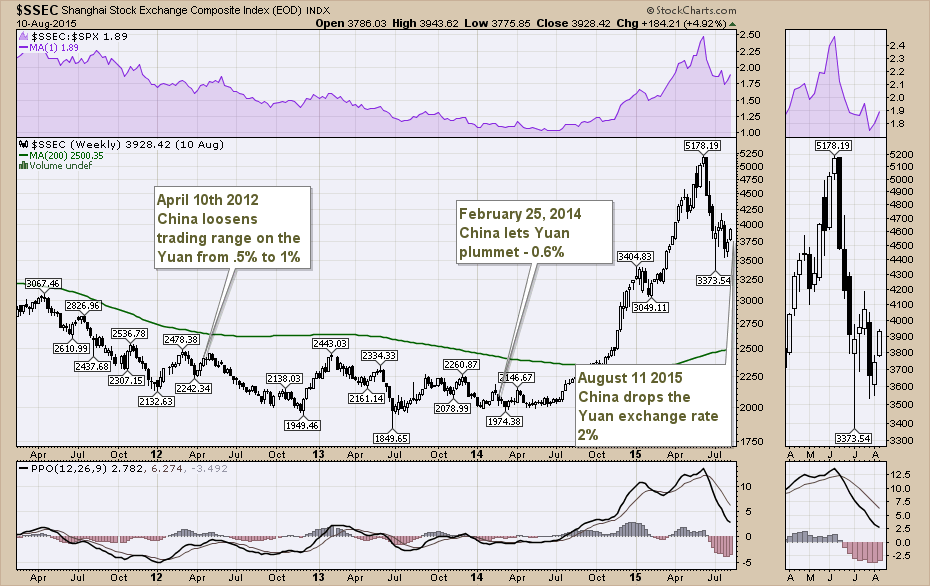
China has been moving the Yuan Currency around over the last few years. Here are the remarks I have on the Shanghai ($SSEC) chart about the Yuan. These are the only extreme ones I noted watching the markets. Shortly after widening the range back in 2012, the Yuan fell 2% over a few months. In 2014 The Yuan was dropped 0.6%. This week's move for the Yuan was a big one at 2.0%.
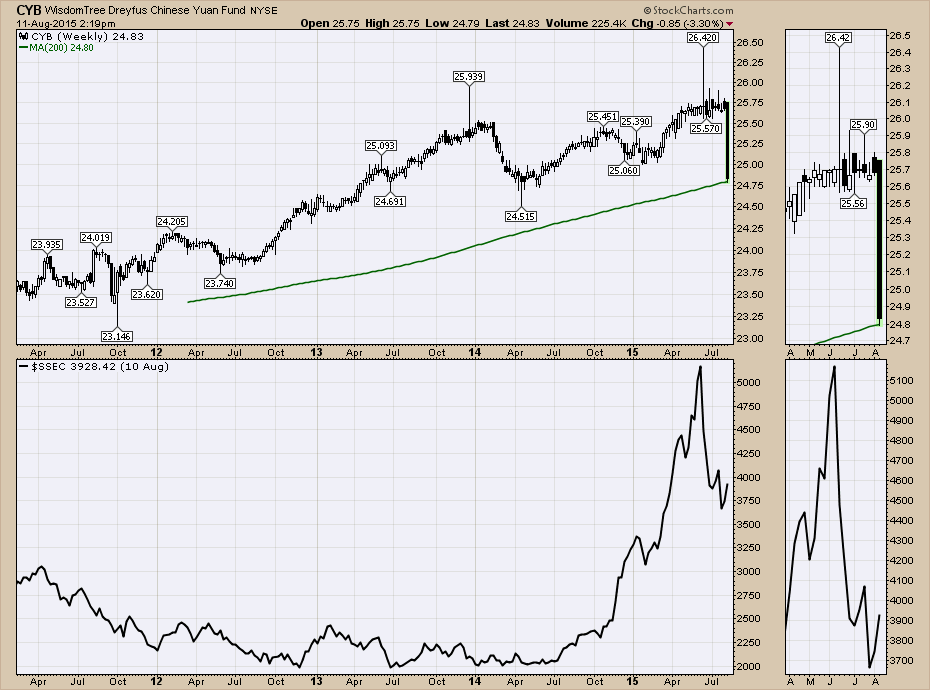
Here is what the 2% move in the Yuan looks like today. The CYB chart does not show a big 1-week move associated with February 25, 2014. However, the currency continued to weaken considerably over the next few months and the equity markets went on to soar 150% over the next year. It would appear the Chinese Government is looking to generate export growth and equity market growth from the same levels where the last surge took place.
The move is considerable when we consider the size of the Chinese economy. A decision to take it to 52 week lows is a big move. We'll watch the equity markets to see if that starts to spur export growth in China after troublesome export numbers were reported within the last week. The last currency move spurred things substantially. We'll watch closely to see how this works for them.
Stay tuned and "Don't Ignore This Chart!"
Good trading,
Greg Schnell, CMT


