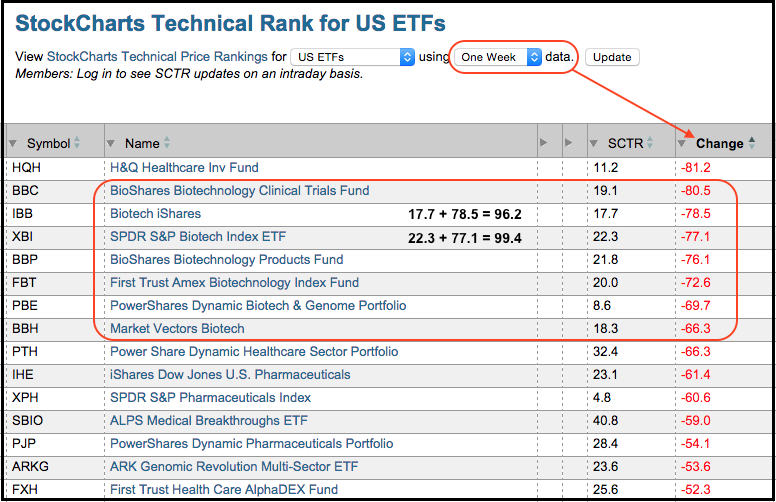
The biotech ETFs have gone from leaders to laggards as the StockCharts Technical Rank (SCTR) plunged double-digits over the past week. The image below shows the ETFs with the biggest decline in their SCTR over the past week. You can set the time period using the drop down at the top and then sort by clicking the column heading. Also note that our ETF universe for the SCTRs does not include leveraged or inverse ETFs. As the table below shows, the SCTRs for the Biotech iShares (IBB) and Biotech SPDR (XBI) were above 95 just a week ago. We can deduce this because their SCTRs are down some 77 points and currently in the low 20s. The SCTR ranges from zero to one hundred with zero as the weakest and one hundred as the strongest. IBB and XBI are currently below 20 and this means they are in the bottom 20 percent for ETF performance. I will show the head-and-shoulders top in XBI after the jump.
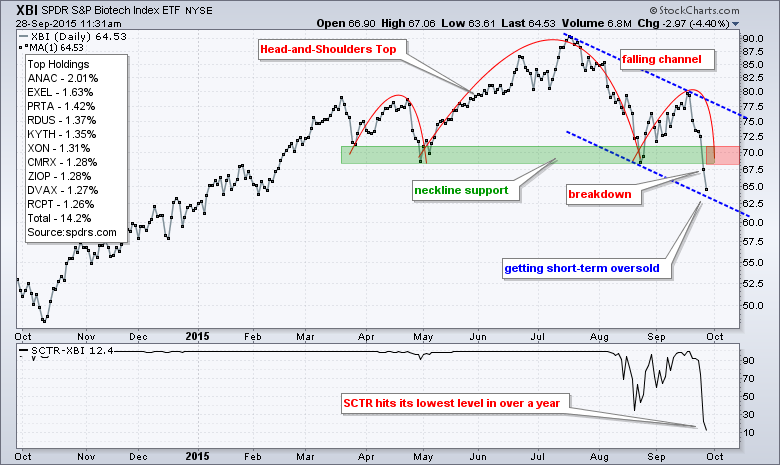
The next chart shows the Biotech SPDR (XBI) forming a head-and-shoulders top from April to September and breaking neckline support with a sharp decline the last two days. Regardless of the pattern, the ETF formed a lower high in mid September and broke below its August low. This lower high and lower low sequence means the ETF is in a downtrend. The blue trend lines mark a falling channel and the ETF is nearing the lower trend line, which suggests that XBI is getting short-term oversold. Broken support in the 70 area turns into the first resistance area to watch should the ETF bounce.
******************************************
Thanks for tuning in and have a good day!
--Arthur Hill CMT
Plan your Trade and Trade your Plan
******************************************


