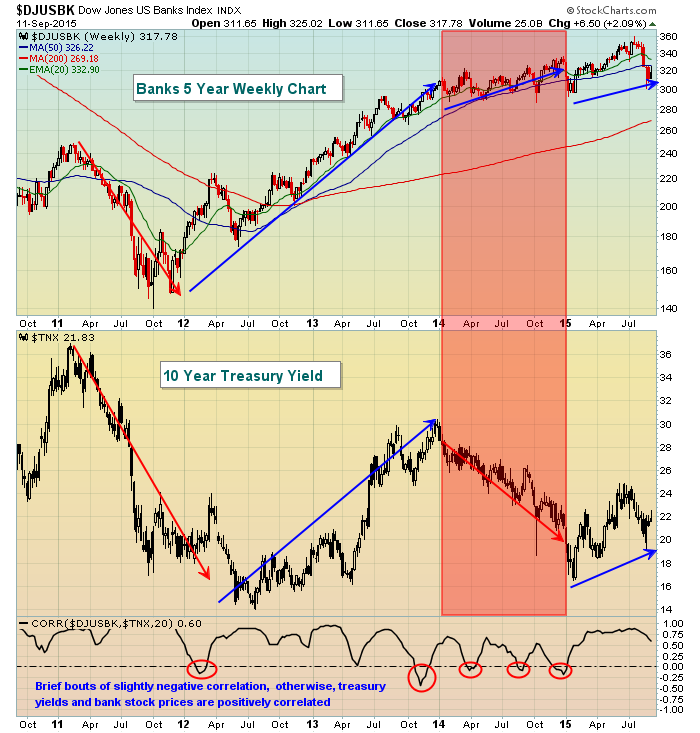
As we await the Fed's interest rate decision this week, it's a good time to review a key area of the market that is heavily swayed by the direction of interest rates - banks ($DJUSBK). As the 10 year treasury yield ($TNX) rises and the yield curve steepens, the net interest margin (key profit driver) for banks grows. The chart below illustrates that there's a fairly tight positive correlation between the direction of the TNX and the direction of the DJUSBK. Recently, the TNX came under some pressure and that took a toll on bank stock prices. Over the past few weeks, however, there's been a resurgence in treasury yields to the upside with the 2.20%-2.25% area providing a serious short-term obstacle. If the treasury market begins to believe that the Fed is serious about hiking rates, I'd look for a break this week above 2.25% and banks to perform extremely well on a relative basis vs. the S&P 500. Should the Fed hesitate and hold rates steady at this week's meeting, it could be viewed as a sign of economic weakness and a harbinger of more downside ahead for equities in general and banks more specifically. Check out the correlation over the past five years:
Happy trading!
Tom


