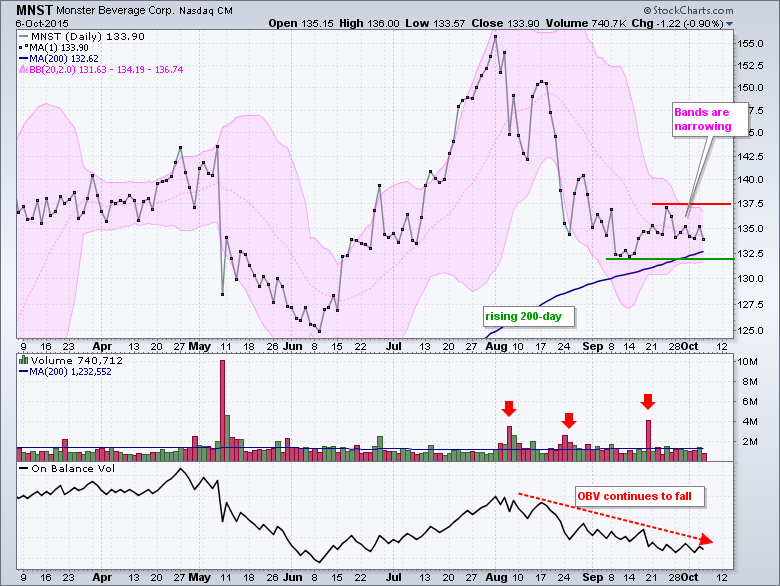
Monster Beverage (MNST) did not partake in the early October surge and a key volume indicator suggests that distribution is underway. Let's start with the price chart. MNST fell sharply in August and then firmed just above the rising 200-day moving average in September. Volatility contracted as the stock moved into a rather narrow range (137.5 to 131.5 on a closing basis). John Bollinger, creator of Bollinger Bands, theorized that a volatility expansion follows a volatility contraction and this means chartists should prepare for a move. But which way?
The indicator windows show volume and On Balance Volume (OBV), which quantifies volume. OBV adds volume on up days to show accumulation and subtracts volume on down days to show distribution. Even though MNST surged to a new high this summer, OBV did not confirm and formed a lower high. Notice that OBV peaked in early August and moved lower the last two months. This suggests distribution and increases the odds of a support break. Turning back to the chart, Bollinger Bands and the support-resistance lines are the first levels to watch. A close above 137.5 would break the upper band and exceed resistance, which would be bullish. A close below 131.5 would break the lower band and exceed support. Such a move would also break the 200-day and this would be bearish.
****************************************
Thanks for tuning in and have a good day!
--Arthur Hill CMT
Plan your Trade and Trade your Plan
*****************************************


