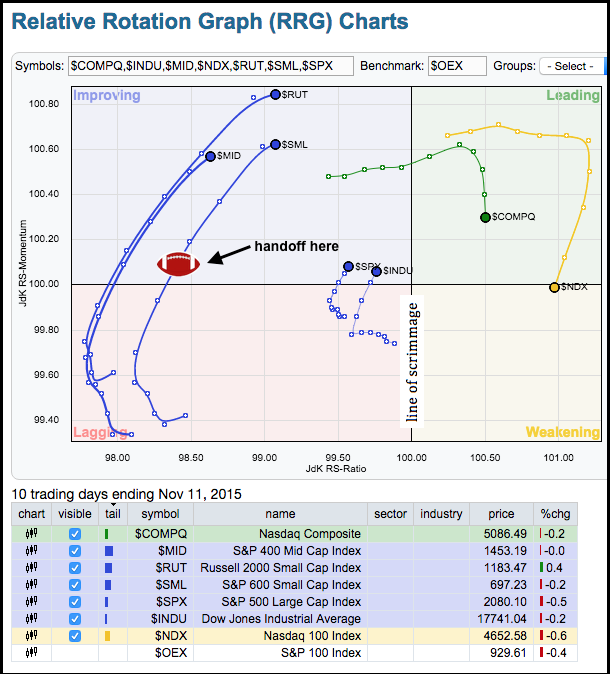
Small-caps are still underperforming large-caps, but the small and mid-cap indices moved into the improving quadrant on the Relative Rotation Graph (RRG) with a classic end-around play. Just go to YouTube if you need to review this play. The RRG shows performance for the S&P Small-Cap 600, Russell 2000, S&P MidCap 400 and a few others against the S&P LargeCap 100. The vertical line at 100 marks the line of scrimmage and this is the difference between a successful end-around and a failure. A move past 100 would put these three in the leading quadrant (green) and suggest that small-caps are starting to outperform large-caps. You can read more about Relative Rotation Graphs in our ChartSchool.

Click this image for a live chart.
****************************************
Thanks for tuning in and have a good day!
--Arthur Hill CMT
Plan your Trade and Trade your Plan
*****************************************


