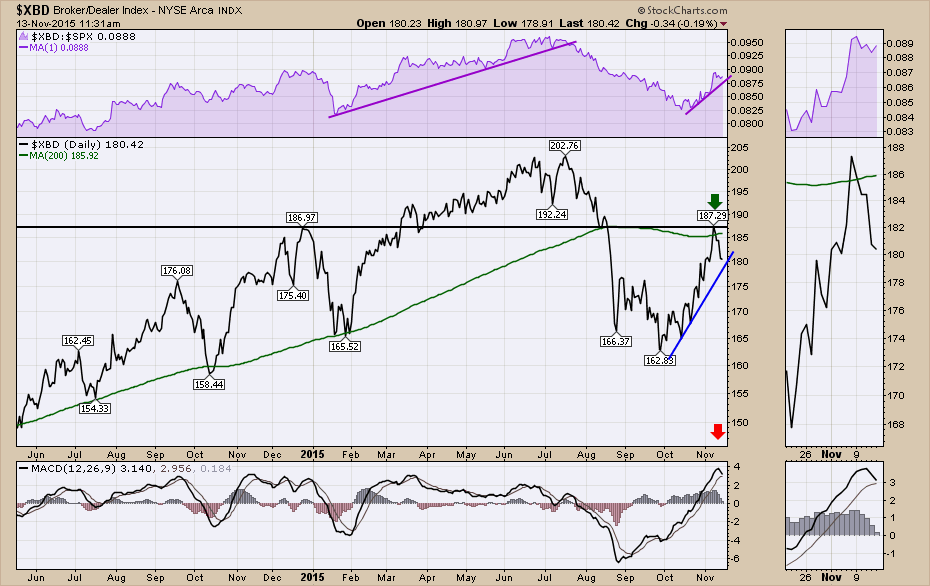
In bull markets, brokers do very well. On the back of the recent rate rise, the Broker-Dealer Index ($XBD) ran up to test the 200 DMA. Now the chart warrants close scrutiny.
On a Year to Date basis, the results are essentially flat, but the support-resistance line at $187 seems very important. This level marked the highs of 2014. As well, this was the level before the market dropped in August 2015. Now we have come back to retest it and so far it looks like we have failed. The 200 DMA is also here so a failure to get above a long-term trend that the index has been above for years is pretty important.
After a meteoric rise on the MACD, it would appear to be rolling over. So far, the relative strength shown in purple is holding up. If this index starts to underperform the $SPX now, that has bearish connotations as usually brokers are a leading indicator. The fact that the index is nowhere near the previous highs as the broader market indexes were near their highs last week is noteworthy. At this point in time, no trend lines have been broken, so we'll see if the power can persist. As a leading indicator, it is a good one to watch. It highlighted the top of the $BDX move in the summer when the relative strength started to break down.
Good trading,
Greg Schnell, CMT


