The first thing to investing or trading smarter is understanding your own personal strategy - what works best for you. Are you a short-term trader? Do you swing trade? Do you prefer longer-term holding periods? Without understanding that basic personal trait, deciding whether to buy or sell becomes a very emotional decision. And market makers THRIVE on short-term emotional trading. Take Tech Data (TECD) as an example. In August, TECD soared on solid quarterly results while just last week the company tumbled on its latest results which were below Wall Street expectations. If you focus squarely on the short-term and "chase" the action, TECD was a buy in August and became a sell last week. The problem is that TECD opened close to the same price each time. I generally favor short-term term trading, but thought I'd focus this DITC chart on TECD's weekly channel, which remains strong. Take a look:
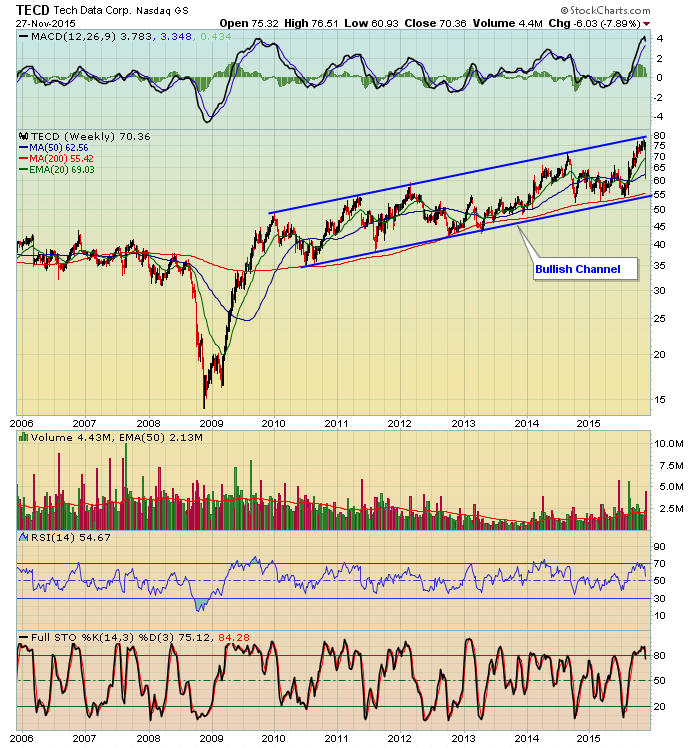
For the past 5-6 years, TECD has remained in a very bullish channel to the upside, but there have been short-term periods of weakness within this channel higher - like last week. A short-term trader would look to capture gains during trends higher and avoid the whipsaw created by quarterly earnings results. The medium- to longer-term trader would focus on this channel and continue to hold through earnings reports and for as long as the uptrend continues. So while many short-term traders might view last week's poor showing to be a sell signal, long-term traders might view it as an opportunity. But if you're of the longer-term mindset, just understand that the trendline support isn't reached until TECD falls another 20% to the 55 area. It's unfathomable for the short-term trader to be consider holding that long to major trendline support.
This chart isn't designed necessarily to suggest TECD as a buy or a sell, but rather to point out how the chart might be viewed by two different traders depending on their individual trading bias and strategy.
Happy trading!
Tom
