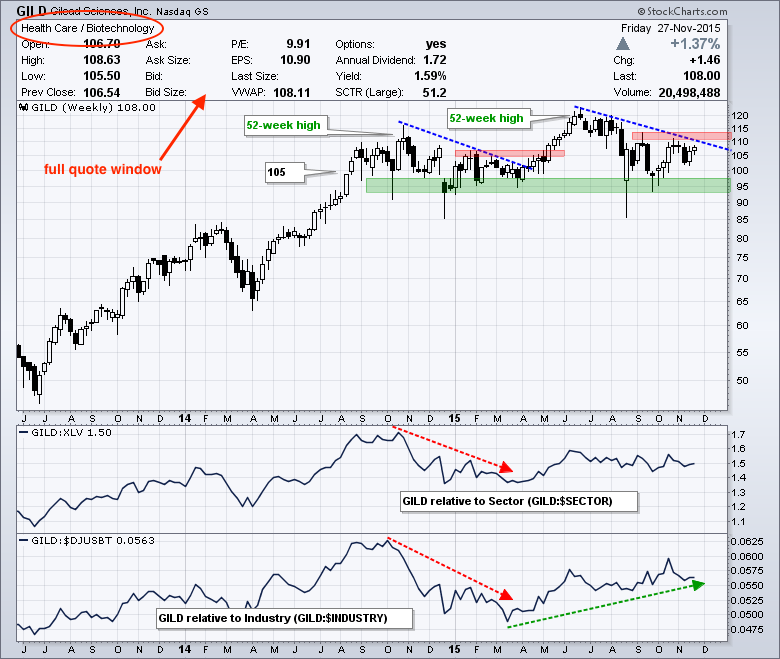
Gilead is up for the most boring biotech award because the stock has traded relatively flat since September 2014. Despite numerous crosses of the 105 area, the overall trend is still up and chartists should watch for a breakout to signal a continuation of this uptrend. On the price chart, GILD recorded 52-week highs in late 2014 and mid 2015. The stock also held support in the 95 area from October 2014 until October 2015. The combination of solid support and higher highs indicate that the bigger trend is still up. More recently, the stock pulled back the last 5-6 months and established resistance in the 110-113 area. A break above this resistance zone would argue for a continuation of the bigger uptrend and project a move to new highs.

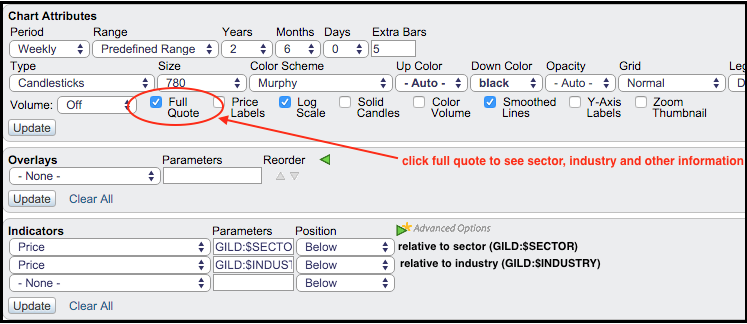
The indicator windows show the stock relative to its sector (XLV) and its industry group ($DJUSBT). As the example below shows, I am using the price relatives to measure relative performance ($GILD:$SECTOR and $GILD:$INDUSTRY). SharpCharts users can simply use the symbols $SECTOR and $INDUSTRY to automatically select the corresponding sector and industry group. If you change GILD for Home Depot (HD) as the main symbol, the $SECTOR and $INDUSTRY symbols will automatically change to reflect the appropriate sector and industry group (XLY and $DJUSHI). The image below shows how the check the "full quote" box for detailed information and how to create ratio charts to measure relative performance.

****************************************
Thanks for tuning in and have a good day!
--Arthur Hill CMT
Plan your Trade and Trade your Plan
*****************************************


