Southwest Airlines (LUV) has been one of the few airline stories where investors have been able to make money since 2012 from buy and hold. Through the summer of 2015 Southwest had one of its biggest selloffs in 3 years. Some of the airlines are trading around their 200 DMA but Southwest is well above on every metric. The long term chart looks great with the price tucked up top right on the chart.
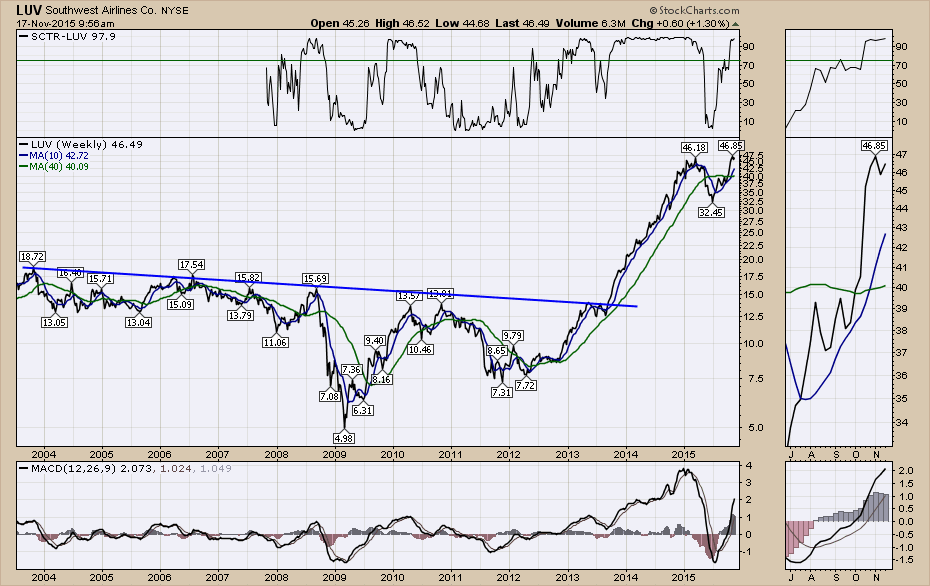
Southwest is trying to make a break above the spring highs after trying last week and pulling back.
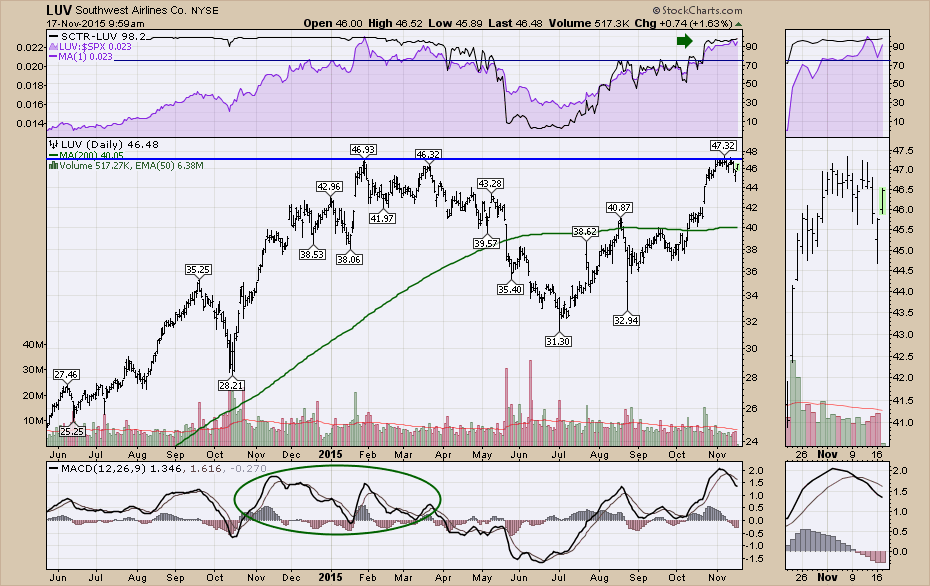
While the MACD is rolling over from a high level, it made the same sort of push in November 2014. In general, there is a lot to love with Southwest as it tries to hit new blue sky above. With the $SPX RS and the SCTR pushed to the top corner of the chart, there is a lot working. Tight stops are recommended until we see if the general indexes have enough power to push through resistance.
Good trading,
Greg Schnell, CMT


