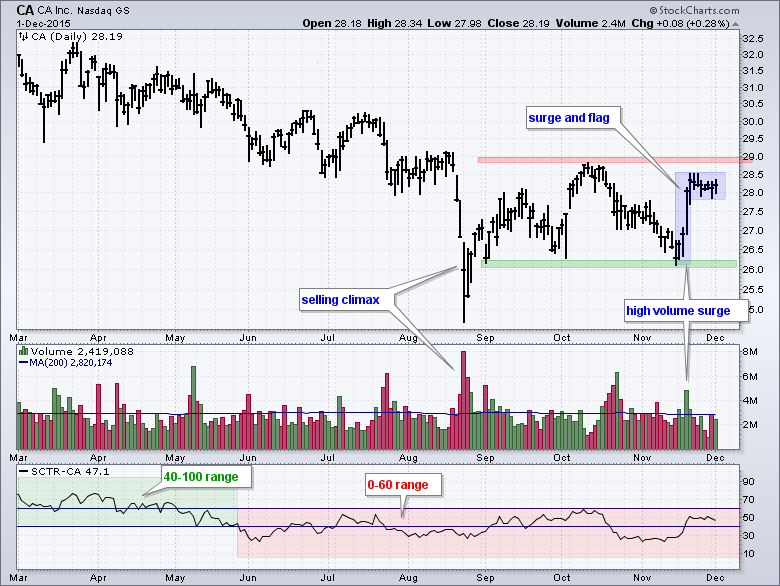
CA Inc (CA) remains in a downtrend, but a reversal could be brewing as the stock forms a high and tight flag just below key resistance. CA was trending down most of the year and then formed a selling climax with a sharp decline on high volume in August. The stock then moved into a trading range with support at 26 and resistance at 29. A break above 29 is needed to forge a higher high and complete a trend reversal here. Within the trading range, the stock surged off support and consolidated with a flag-like pattern. A break out of this flag pattern would provide the early indication that the stock will break the bigger resistance zone at 29.
The indicator window shows the StockCharts Technical Rank (SCTR) with the relative weakness zone shaded red and the relative strength zone shaded green. As with RSI, I view relative performance as net positive as long as the SCTR holds above 40 and moves within the 40-100 zone. Relative performance turns negative with a move below 40 and remains negative as long as the SCTR remains below 60. This means it trades in the 0-60 range. The SCTR is currently in the relative weakness zone and a break above 60 is needed to start showing relative strength again. Click here for a complete SCTR table.
****************************************
Thanks for tuning in and have a good day!
--Arthur Hill CMT
Plan your Trade and Trade your Plan
*****************************************


