The US Dollar ($USD) is always one of the most important factors in the world markets. A strong dollar has been a major headwind for commodities and emerging markets since the 2011 lows. Many investors are watching for commodities to bounce off the oversold levels they are at, but most of the discussion has been on mean reversion, not any sort of new bull market. Both Crude Oil ($WTIC) and $GOLD made new monthly closing lows at the end of November continuing their downtrends as the US Dollar made new monthly closing highs.
As the US Dollar approaches previous resistance, it is important to see if it can break above the previous highs or if it rolls over at resistance. The dollar was above the 98.43 August high for most of November. Now we have been testing this 100 level for over a week with very small intraday moves and no real thrust either way but we continue to edge higher. We closed two days in a row above 100 which means that the daily close, last weeks' weekly close and Monday's monthly close were all above 100. More importantly, this was the first monthly close for the $USD above 100 in 12 years.
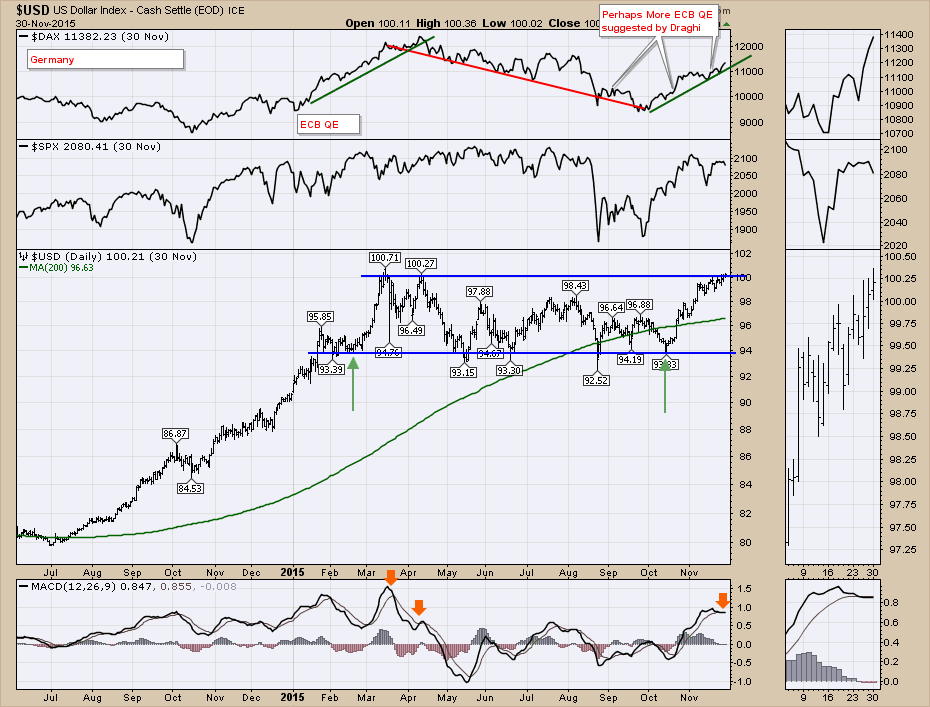
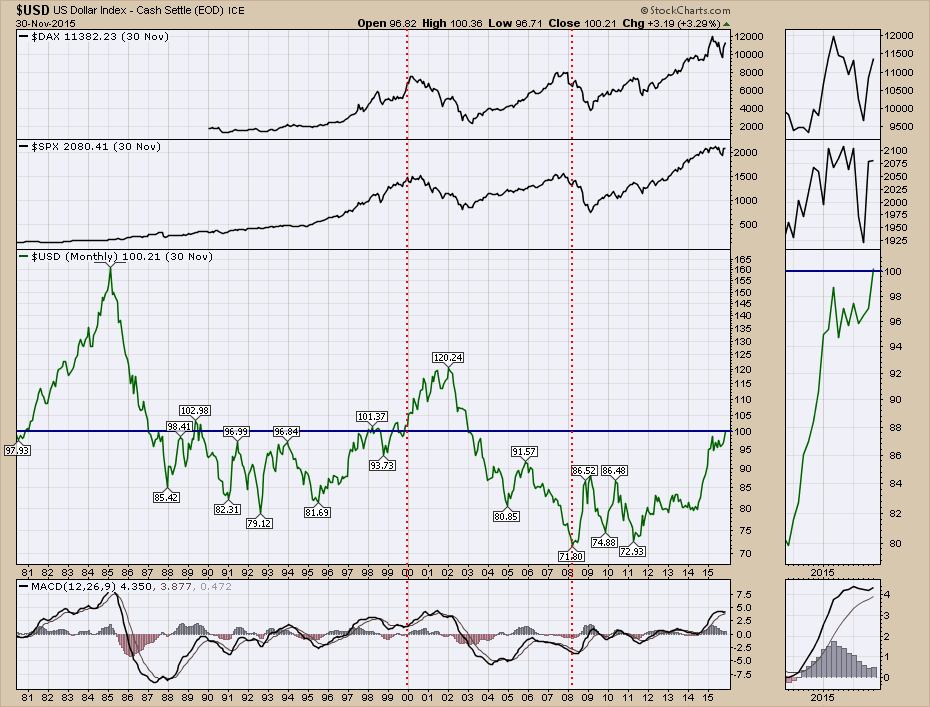
A review of $USD history is important to see if this level has been significant in the past. Almost every corporation has been discussing the strong US Dollar as part of their earnings announcements. The US Dollar has traded in a range between 94-98 for the last 6 months. In general, the corporations are suggesting a dollar in this 94-98 range is too high. Expecting it to move outside this range and not damage the economy might be expecting too much. Here is the macro view going back 35 years.

Starting at the red line in December 1999, the dollar broke out above 100, which was the previous ceiling on the trading range for the dollar from 1987 to 1999. The push in 2000 on the dollar above 100 also coincided closely with the top in world markets in March. The reversal in the dollar started in 2002 and led to a new bull market in commodities and industry. Gold and Oil both made higher lows in 2002 as the dollar rolled over. The American stock markets bottomed in 2003 as the dollar fell below 100. From 2003-2007, the dropping dollar led a big expansion in the American market.
Within that bull market, the stock market stalled for most of 2004 even with a dropping dollar. 2005 was a fabulous year for the $SPX rising 30% in the face of a rising US dollar from 80.85 to 91.57. Notice that the bounce off the 80.85 level in 2005 was a test of the previous lows in the 1990's. After rolling off of the highs of 91.57 in 2006, the 86 level would become the new high for the dollar and would remain below that for 8 years through 2014.
The US Dollar started to rally in January 2008, off what would become its final monthly low as it became a safe haven for the financial crisis. Price action on the dollar stayed below the financial crisis peak until 2014. Now at December 2015, we have moved away from a median price of 80 that was in place from 2007-2014. This 20 point move has put pressure on US exporters. The real question is whether or not a dollar above 100 indicates the same thing it did back in 2000 which ended up being a global slowdown.
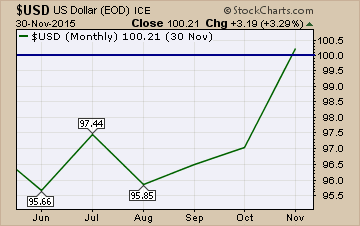
One interesting point on the monthly chart above is how often the dollar was either turning or crossing important levels on the January month end close. Notice on the mini chart example below, the November close falls on what looks like the first of November, but it is a monthly chart so it is showing you the close of November.
The January close actually falls on the line marking the first reading of the year on a monthly line chart like chart 4 below. It is not the December 31st reading. Study the duplicate chart below to see what I mean about the importance of the January close. In 1981, it broke through 100. 1982,1983,1984 were all interesting reversals. 1985 marked the final top. 1986 stopped the free fall for 3 months. 1987 crossed below 100. 1988 marked the final momentum low of the push-down. 1991, 1992, 1993 and 1994 all had reversals. 1997 started an extreme move up. 1998 crossed 100. 1999 marked the last low before running up to 2002 highs. 2000 marked the breakout above the resistance level and the cross above 100 that held. 2001 stopped a 5 point move and reversed higher, 2002 marked the top. 2003 crossed over the 100 level. 2004 started a 6-month pause, 2005 marked the low. 2006 marked the high, 2008 marked the final low. 2009 and 2010 were important as well. 2011 was at the 80 level which had been long term support before the financial crisis. 2012,2013 and 2014 all closed around the same level of 80. In hindsight, the four January readings of 2011-2014 right around 80, would appear to be the calm before the storm as we pushed to 95 for 2015.
With the expected ECB QE announcement and the US jobs data at the end of December's first week, this will probably impact the dollar. Next week we have the Fed meeting which will impact the dollar. December might become a month to remember as the world has been slowing similarly to 1999. But more importantly, the January close might be the big one to watch. How the next two months plays out will be very important, now that the $USD has pushed and closed above the recent trading range, above the 100 level, and is almost at 1-year highs on the daily OHLC chart at the top of the article.
Good trading,
Greg Schnell, CMT


