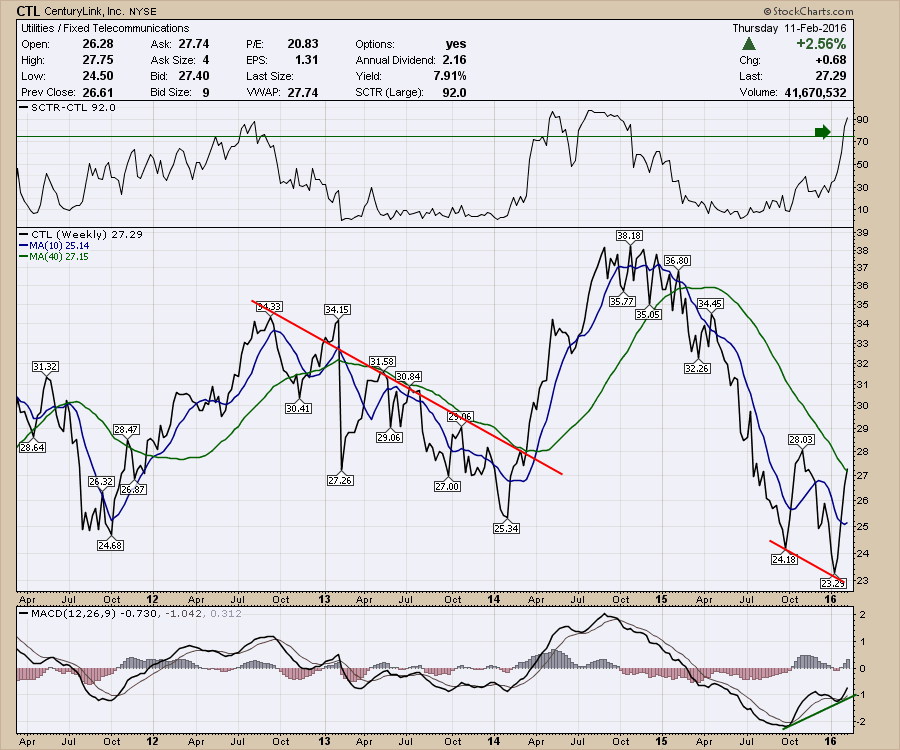
Centurylink (CTL) is in the Utility Sector as a fixed communication broadband provider. While they have other operations, the chart is interesting today for a few reasons. It's in a top sector, it's in a top industry group, it pays a healthy dividend (7+%) and the SCTR roared above 75 for the first time in almost a year.
I really like the positive divergence on the MACD on a weekly chart. The lower in early January 2016 and the higher low on the MACD (which indicates momentum) is why we call it a positive divergence. The momentum has improved even though the price is making a lower low.
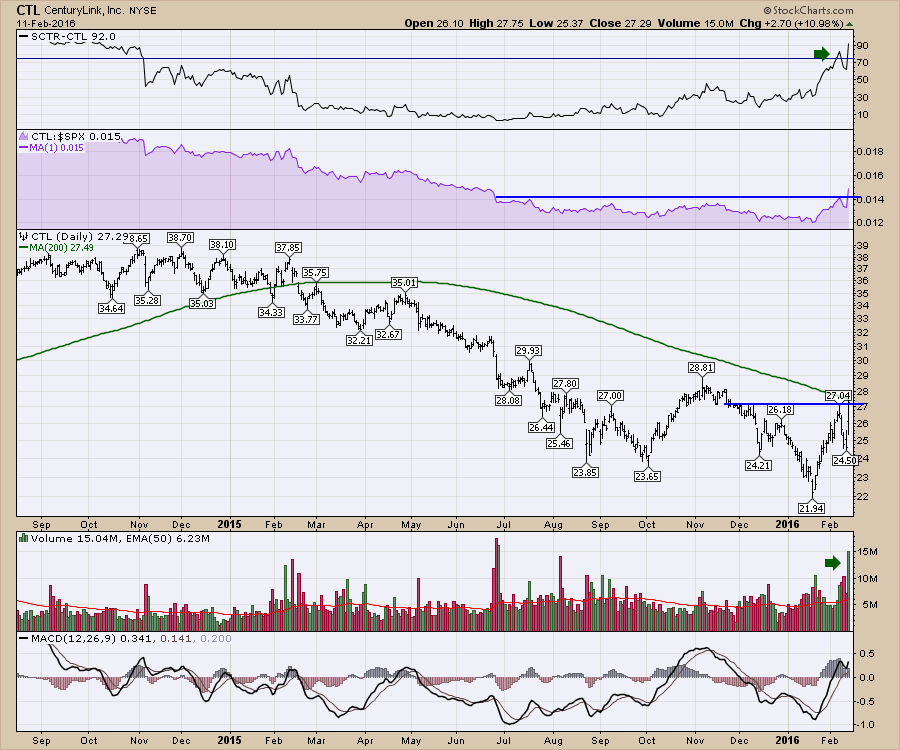
Looking at it on a daily chart, there are some interesting things as well. The Relative Strength shown in purple is at new 6-month highs. The price is moving to a new three-month high. It is currently challenging its 200 DMA. The volume was big on yesterday's down day for the broader market. With only 17% of the stocks above the 200 DMA on the NYSE, this stock is trying to join the leaders.
 One other interesting tidbit about the tools on StockCharts.
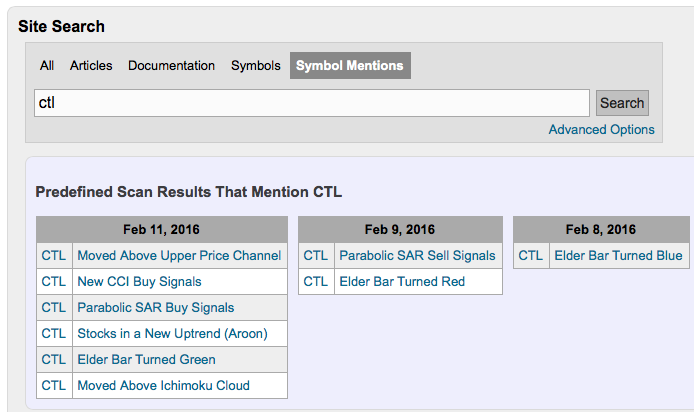
StockCharts Search Box in the top right corner on the homepage gives some interesting information. It will tell you if any predefined scans triggered recently. Here is an example.
 If you put in a stock like Apple (AAPL), it will spew off reams of data including every time the stock was mentioned in a blog or public chartlist.
I think Centurylink (CTL) makes a case for involvement here. But in all markets, have a plan and trade the plan. Have a good long weekend!
Good trading,
Greg Schnell, CMT


