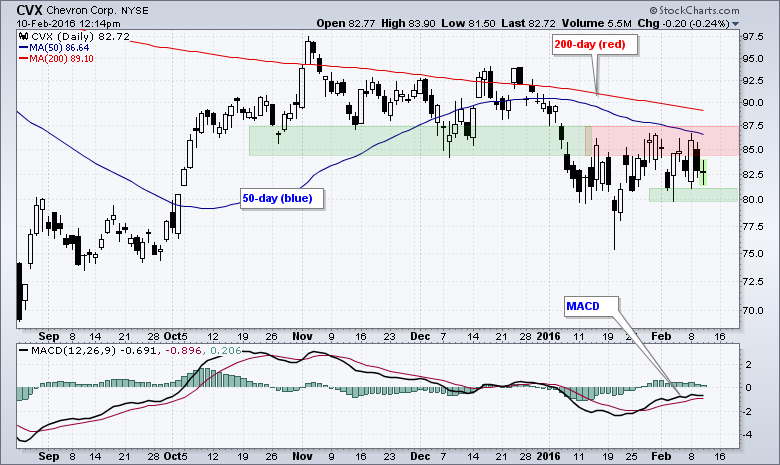
Chevron (CVX) is a long-term downtrend and looks vulnerable to another leg lower. The price chart shows CVX trading below the falling 200-day moving average and below the 50-day moving average. Also notice that the 50-day is below the 200-day. These relationships indicate that the long-term trend is down. The stock recently broke support with a sharp decline in early January and then rebounded back to the broken support zone in late January. This zone turned into resistance as the stock failed to break back above 87.5 the last two weeks. At this point, Chevron looks vulnerable to further weakness and chartists should watch for a bearish signal. A break below support at 80 would be bearish on the price chart. A bearish signal line cross in MACD would also trigger a signal.
****************************************
Thanks for tuning in and have a good day!
--Arthur Hill CMT
Plan your Trade and Trade your Plan
*****************************************
