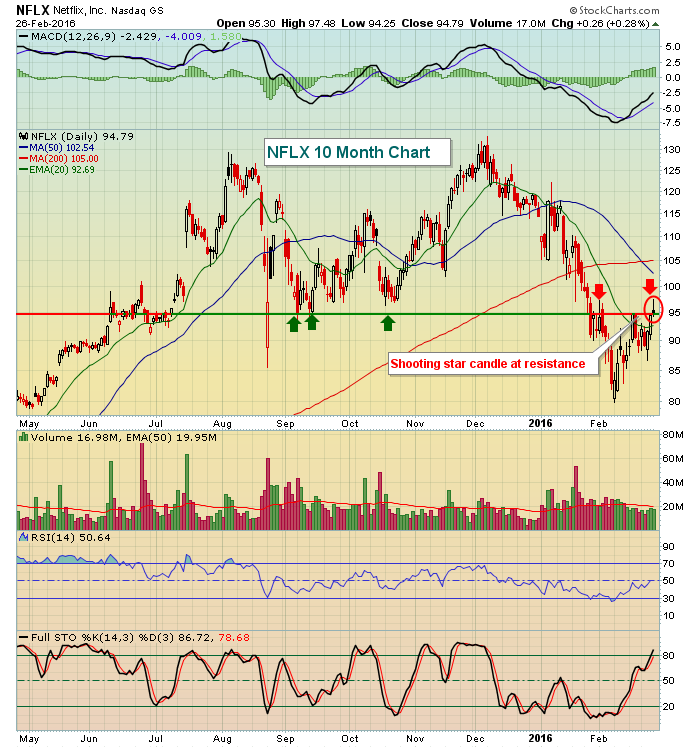
Over the past few months, traders have shunned risk and we've seen many high flyers begin to take big hits. Netflix (NFLX) certainly fits that category and hasn't been immune to the selling. Recently, NFLX traded at a high of 133.27, but has since fallen to a near-term low of 79.95 reached on February 8th. It's since rallied 22% in less than three weeks as we've seen an oversold bounce in the U.S. market. Friday's candle on NFLX may have ended the short-term run, however, as shooting stars off uptrends can mark short-term tops. The stock's propensity to pivot at 95 adds a great big question mark as well. Check out the daily chart:
 In addition, the rapidly declining 20 week EMA on the weekly chart adds further resistance close to 100 as weekly momentum is horrible, with its MACD recently breaking beneath centerline support and pointing downward. Check it out:
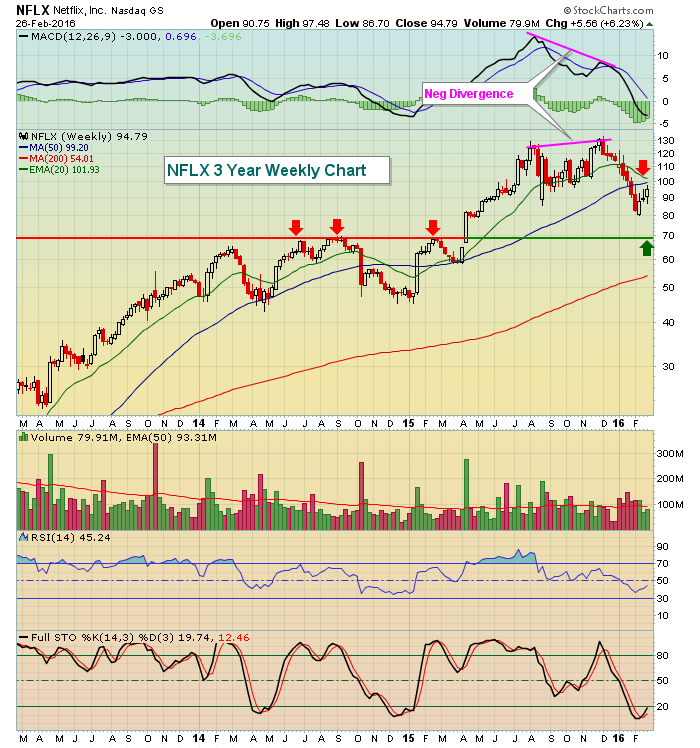 The weekly negative divergence at NFLX's top suggested the stock could be in for an extended period of selling. Based on the accelerating selling momentum and an open retest close to 70.00, I believe the path of least resistance is lower. A high volume push through 100-102 would negate the current bearish signals.
Happy trading!
Tom


