The Solar Energy ETF (TAN) has been one of the weakest industry group ETFs over the past year and that looks set to continue with the recent breakdown. The chart shows TAN bouncing with the market from mid February to mid March and hitting resistance near broken support. This is a classic tenet of technical analysis: broken support turns into resistance (and vice versa). The ETF challenged resistance twice in March and then broke support with a sharp decline the last two days.
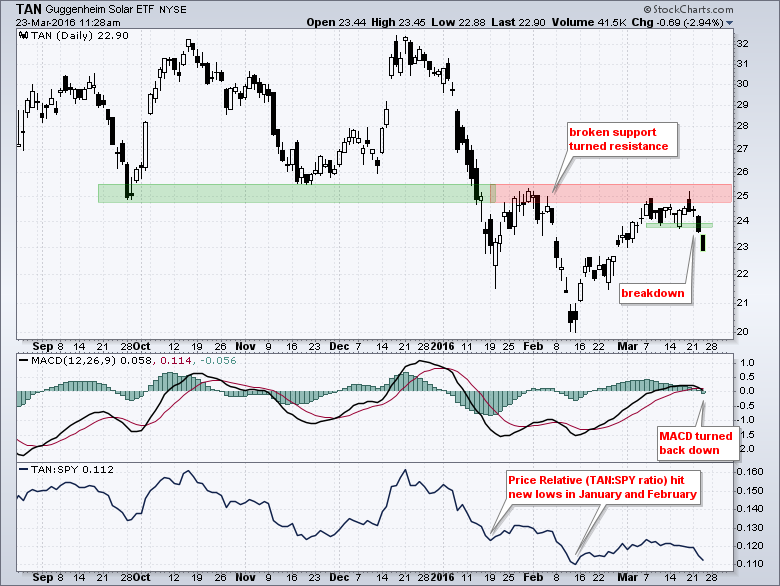
The indicator windows shows momentum turning down and the ETF underperforming the broader market. MACD turned positive for several days in mid March, but then moved below its signal line today (black line crossing below red line). The price relative (TAN:SPY ratio) hit new lows in January-February, bounced into early March and then turned back down the last few weeks. The bulk of the evidence on this chart is clearly bearish and points to a test of the February low, or even a new low.
****************************************
Thanks for tuning in and have a good day!
--Arthur Hill CMT
Plan your Trade and Trade your Plan
*****************************************


