While the world tries to solve the riddle of global demand, the Internation Small Cap ETF (GWX) moved above resistance last week and needs to hold $28 to remain bullish. The chart shows some nice trends. The SCTR is trying to push above 75. The Relative Strength shown in purple has moved to 5-month highs.
I think the most important information on this chart is the support/resistance line at $28. Going all the way back to 2013, this line has marked an important level. The recent highs in Q4 2015 were trying to stay above $28 and as this support level eroded, the small caps stalled. After having a huge down move in January, we have retraced the entire move as we head into the end of the quarter. A close above $29 over a weekend would create a chart with a higher high on it. If it fails to hold $28 without making a higher high, this would be a very negative signal. There is also some support from the 40 WMA shown in green, but the chart is testing the upside breakout right now. That is the most critical component.
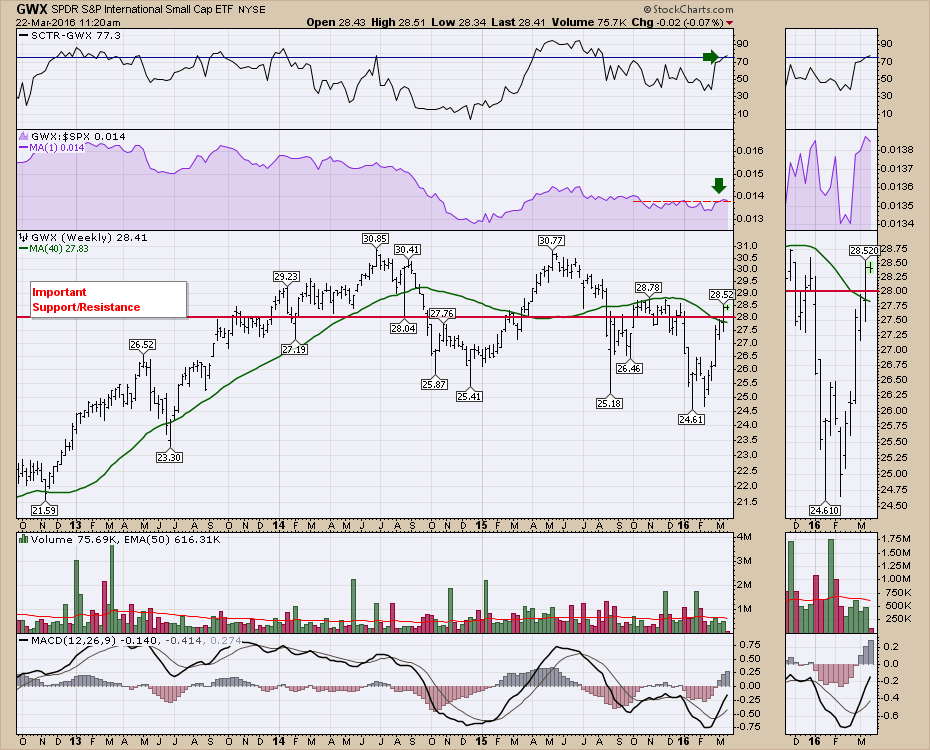
If the ETF can break through $29, this could be a nice long entry. As the overall $SPX has been around this 2050 level since Thursday, there seems to be a reluctance to move higher. I would wait for this GWX trade to show its strength before entering.
I will be presenting The Canadian Technician Webinar 20160322 at 5 EST. There is a lot to cover with the commodities breaking above resistance recently and the $TSX breaking above 13000. Currently, the $TSX is trying to get back above the 40 WMA after a 1500 point rally. There are meaningful signals on the chart. If you have time to watch the webinar live, here is the link. The Canadian Technician Webinar 20160322. You can also catch webinar recordings when it is convenient for you by following this link to our webinar archives. StockCharts Webinar Archives.
Good trading,
Greg Schnell, CMT, MFTA
