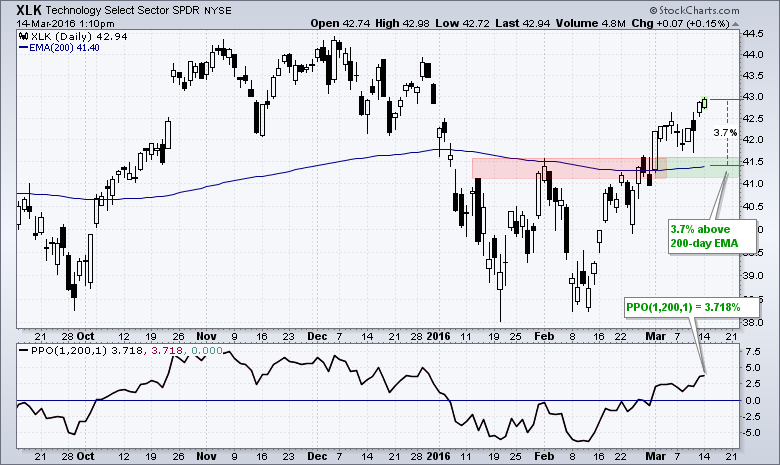
Chartists can measure relative performance by comparing the price to a moving average. In particular, I am going to measure the percentage above or below the 200-day EMA using the Percentage Price Oscillator (PPO). The PPO (1,200,1) measures the percentage difference between the 200-day EMA and the current price. The PPO is positive when price is above the 200-day EMA and negative when price is below.
The chart below shows the Technology SPDR (XLK) with the 200-day EMA and the PPO (1,200,1). Notice that XLK is around 3.7% above the 200-day EMA and the PPO is at 3.718%. Adjusting for some rounding, we can see how the PPO captures this dynamic. Note that the PPO(1,200,1) for XLK is the third highest of the nine sector SPDRs. The Consumer Staples SPDR (XLP) and the Utilities SPDR (XLU) have higher PPOs. By this measure, XLK is the third strongest sector and showing relative strength (relative to the other six).
 Returning to the price chart for some analysis, notice that XLK broke out with a surge on March first and this breakout is holding. The broken resistance zone turns into a support zone in the 41-41.5 area. I would consider this breakout bullish and valid as long as 41 holds on a closing basis. You can read more about the PPO in our ChartSchool.
****************************************
Thanks for tuning in and have a good day!
--Arthur Hill CMT
Plan your Trade and Trade your Plan
*****************************************


