Whole Foods Market (WFM) has been trading in sideways fashion for the past several months and its long-term weekly chart isn't one of the strongest. But there are signs that better fundamental days lie ahead based on technical signs of accumulation. Below is a daily chart of the WFM for the past 8 months:
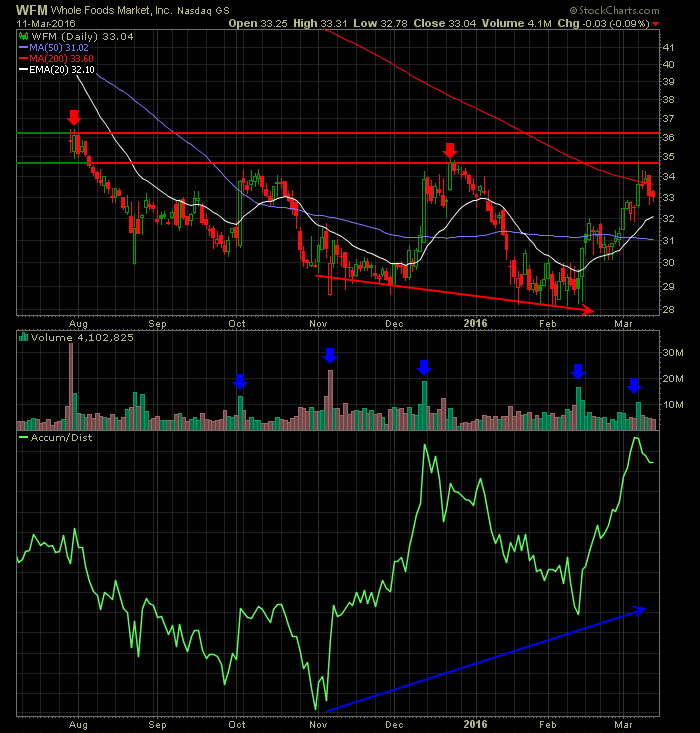 Notice that while prices moved lower in February, the Accumulation Distribution Line (ADL) was well off its low. The blue arrows mark many heavy volume days and if you look at the accompanying daily candlestick, you'll see that most of those high volume days saw WFM close at or near its high of the day. That action triggers upside movement in the ADL, which is very apparent with WFM.
The red arrows mark two key levels of price resistance. Breaking above those price highs with a strengthening ADL would be solid confirmation of a stock potentially under accumulation.
Happy trading!
Tom


