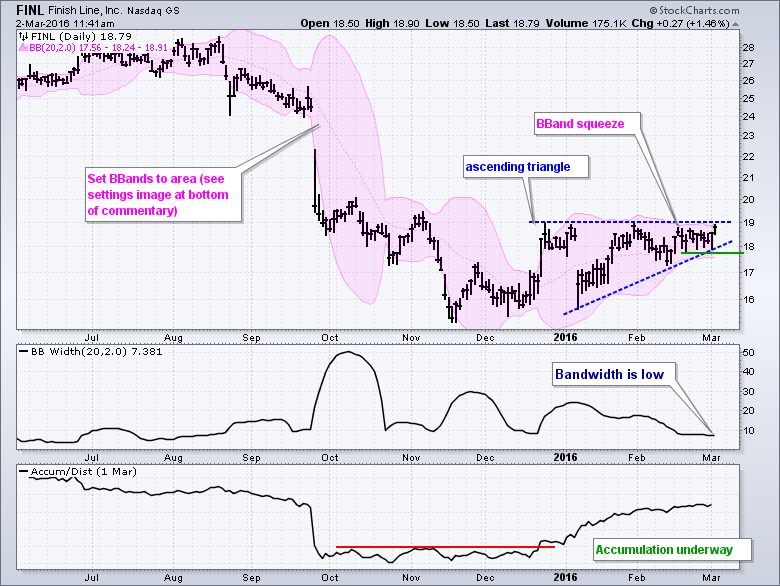
2015 was a rough year for Finish Line and the Retail SPDR (XRT) as both fell rather sharply. FINL was down over 20% and XRT fell over 8%. 2016 is shaping up a bit different because FINL is up around 2% year-to-date and XRT turned positive on Tuesday. Furthermore, FINL sports a bullish pattern with signs of accumulation.
On the price chart, the blue trend lines mark an ascending triangle. This is normally a bullish continuation pattern that forms after an advance, but I think the properties of the pattern are bullish wherever it forms. The higher lows show buying pressure coming in at higher levels and the equal highs represent overhead supply. A break above the pattern highs would be bullish and target a move to the low 20s.
There is a Bollinger Band squeeze underway as BandWidth dipped to its lowest level since August. The narrowing of the Bollinger Bands tells us that there was a volatility contraction and we should now expect a volatility expansion. Bollinger Bands do not, however, provide directional clues. We need to watch the price chart for that and a breakout at 19 would be bullish. And finally, the bottom window shows the Accumulation Distribution Line (ACDL) breaking out in late December and continuing to move higher throughout 2016. This shows signs of accumulation and increases the chances of a breakout.
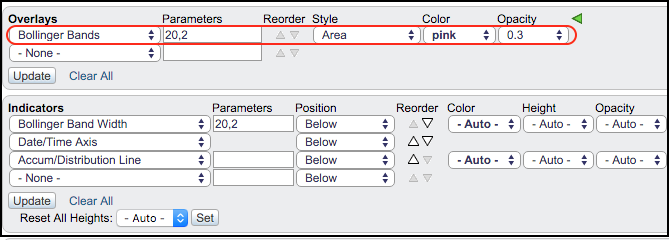
 The Bollinger Bands are shown as a pink area because I selected "area" as the "style" and then set the opacity to .3 using the advanced options.
****************************************
Thanks for tuning in and have a good day!
--Arthur Hill CMT
Plan your Trade and Trade your Plan
*****************************************


