UA is attracting buying interest as March madness moves to the sweet sixteen. Note that UA sponsored 10 teams at the start of the tournament, including Utah and Notre Dame. On the price chart, the stock has a bullish cup-with-handle pattern taking shape. This is a continuation pattern and a breakout would signal a continuation of the late January surge. Typically, the height of the pattern is added to the breakout for an upside target. The height measures around 15 (85 - 70 = 15) and the upside target would be around 100. Take upside targets with a bucket of salt. :<)
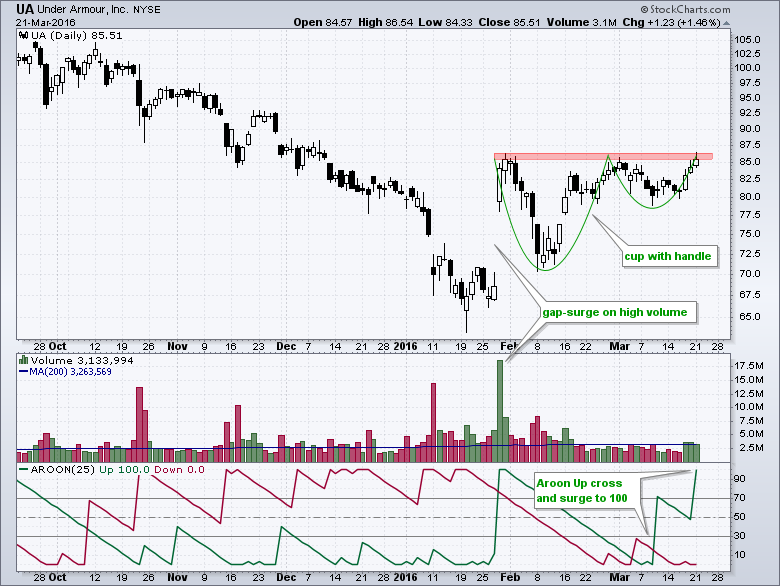
The indicators are also perking up. Notice that upside volume surged in late January and picked up again over the last three trading days. Aroon Up (green) crossed above Aroon Down (red) the second week of March and then surged to 100 on Monday. This puts Aroon Up in full bull mode. A breakout on the price chart is the last piece of the bullish puzzle.
****************************************
Thanks for tuning in and have a good day!
--Arthur Hill CMT
Plan your Trade and Trade your Plan
*****************************************


