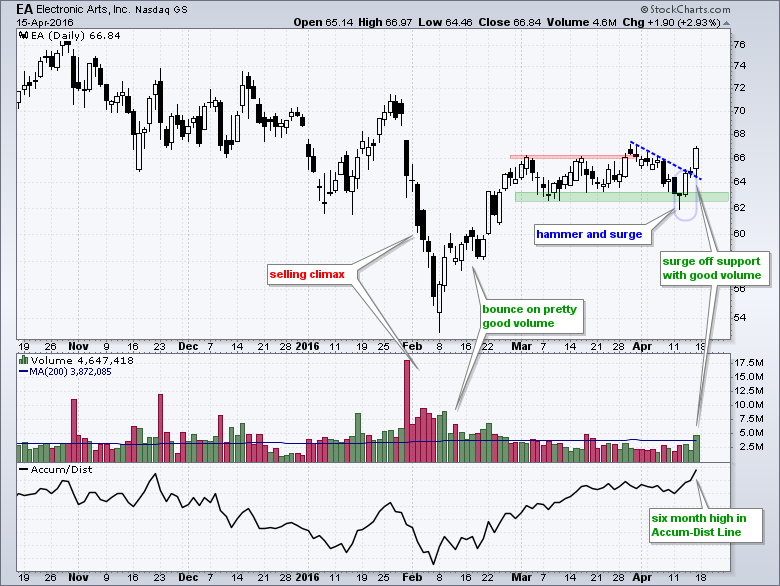
Electronic Arts (EA) got a big bounce off support with expanding volume and a strong Accumulation Distribution Line. On the price chart, EA plunged in late January and early February on high volume and this looks like a selling climax. The stock quickly recovered with pretty good volume and then moved into a consolidation with lots of support in the 62-63 area. A breakout was in the making in late March with the move above 66 (red resistance), but the stock fell back to the support zone in mid April. Just when it look like a support break was in the offing, EA forged a hammer and surged off support with good volume. This strong move affirms support and signals a continuation of the February bounce (~54 to 66).
Chartists can quantify volume by using the Accumulation Distribution Line. This indicator uses price action as a volume multiplier. The multiplier is positive when the close is above the mid point of the high-low range and this shows accumulation. The multiplier is negative when below the mid point and this shows distribution. The Accumulation Distribution Line shows lots of accumulation because it surged last week and recorded a six month high. You can read more about the Accumulation Distribution Line in our ChartSchool.
****************************************
Thanks for tuning in and have a good day!
--Arthur Hill CMT
Plan your Trade and Trade your Plan
*****************************************


