Much has been made of the stock market's recent strength with the $SPX continuing to push above the 200 DMA. One of the underlying concerns for the rally has been the lack of participation for the banks. A seasoned New York Money Manager told me in my first MTA conference that if the bank charts are healthy, you are in a bull market. If the bank charts are suspect, you are not in a bull market. His reasoning was sound. They assign managers to review their customer books. When the bank stocks turn down, it is usually because they see weakness in the broader economy. Tom Bowley did an article on the bank index in yesterday's DITC. Arthur Hill does a great job of outlining the various components of the $SPX and how financials are the largest weighting in the S&P 500 index. Arthur's work is included in our paid membership.
Today I would like to focus on the price action in Bank Of America (BAC) to illustrate the Bull/Bear dilemma as I think it is quite important in the broad market. First of all, the SCTR is quite weak. Throughout this rally, the SCTR has barely budged. If we use the extremes of February, BAC has rallied 30%. If we choose $12, the rally is 20%. Both of these are great in a few months. The real problem for technicians is that the chart still remains below the resistance line shown in green. This same pattern is on the Citi (C) chart, the Goldman Sachs (GS) chart, etc.
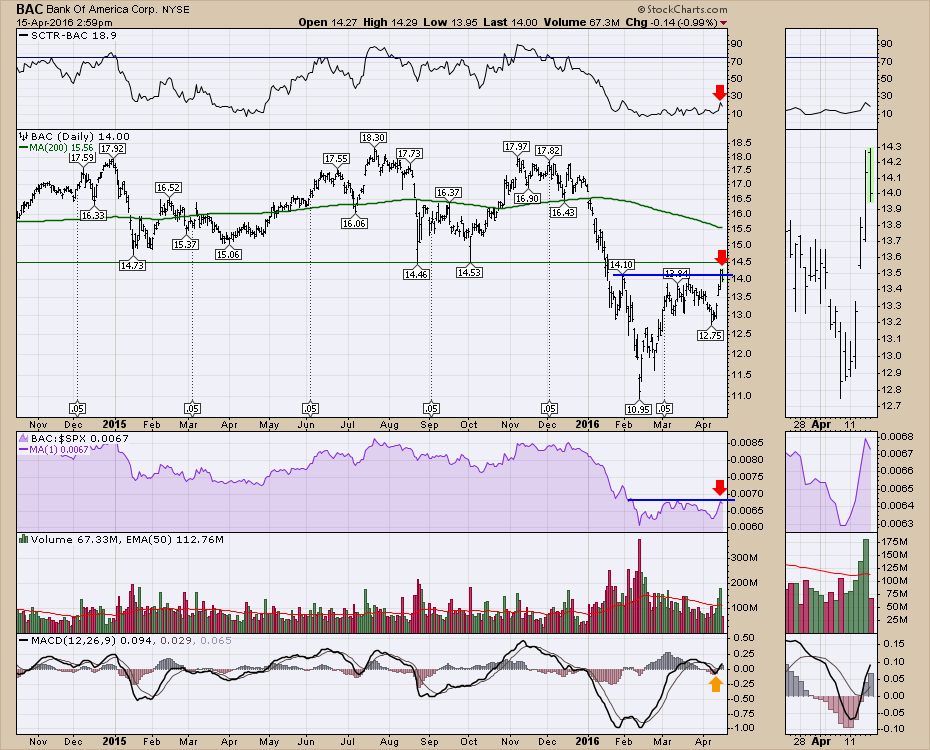
One of the positives on this daily chart is the MACD bounced off the zero level and is in positive territory pointing up. If you marry that with the price trend above trying to break out above the 2-month highs, that is bullish. The struggling relative strength shown in purple has been unable to make 2-month highs. The volume surge on the breakout yesterday was nice to see, but if it gives it all back right away, that is a failed breakout which is very concerning.
Just to cap how important the financials are, Louise Yamada covered them off in her presentation in NYC at the MTA conference. That alone is noteworthy that it is the area of the market she brought to the attention of other technicians. Louise stated one of the reasons her customers missed participating on the downside of the entire slide of 2008 was the failure of the financials being a clue that told her all was not well in July 2007. Here is a look at the BAC chart. Notice that in 2007, BAC spent almost the entire year below the 40 WMA. After a brief rally above to mark the market highs in October, the chart broke below the 40 WMA and started to make one-year lows. The key for Louise was the RS in purple breaking down significantly. Not just on BAC, but on the bank indexes. She saw the breakdown in relative strength as an important signal. If you look closely, you'll see the RS trend on the weekly chart below has been declining since 2016 started.
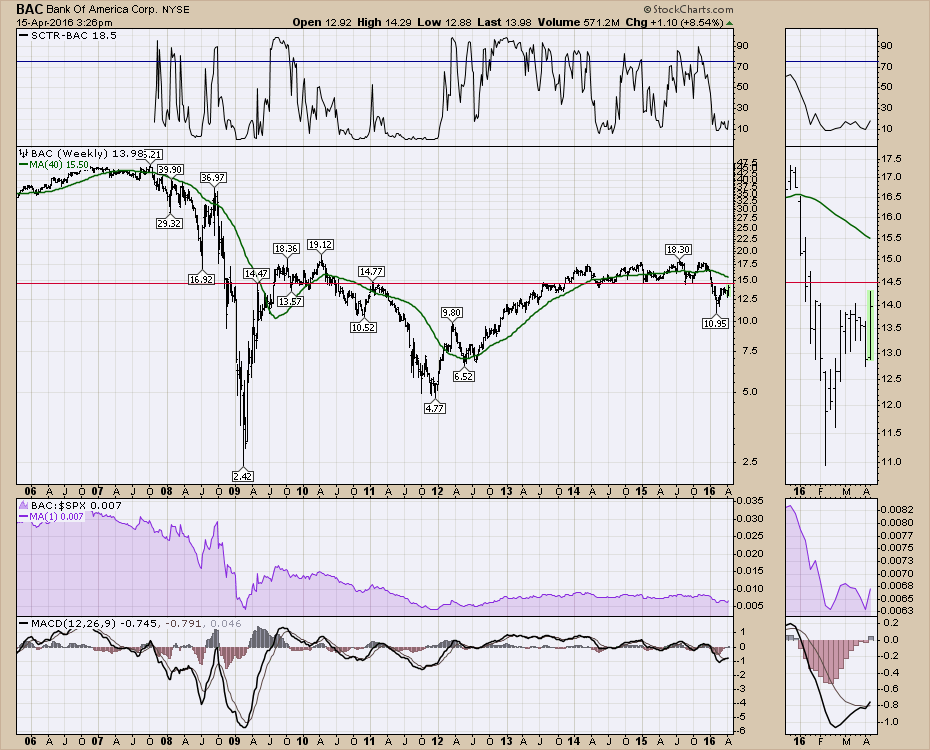 Looking at this weekly chart, notice the negative MACD for the first time since 2012. In the zoom box on the right, it is trying to rally. If it can't, there might be another broad clue in the Bull/Bear debate along with the relative strength.
Good trading,
Greg Schnell, CMT, MFTA.


