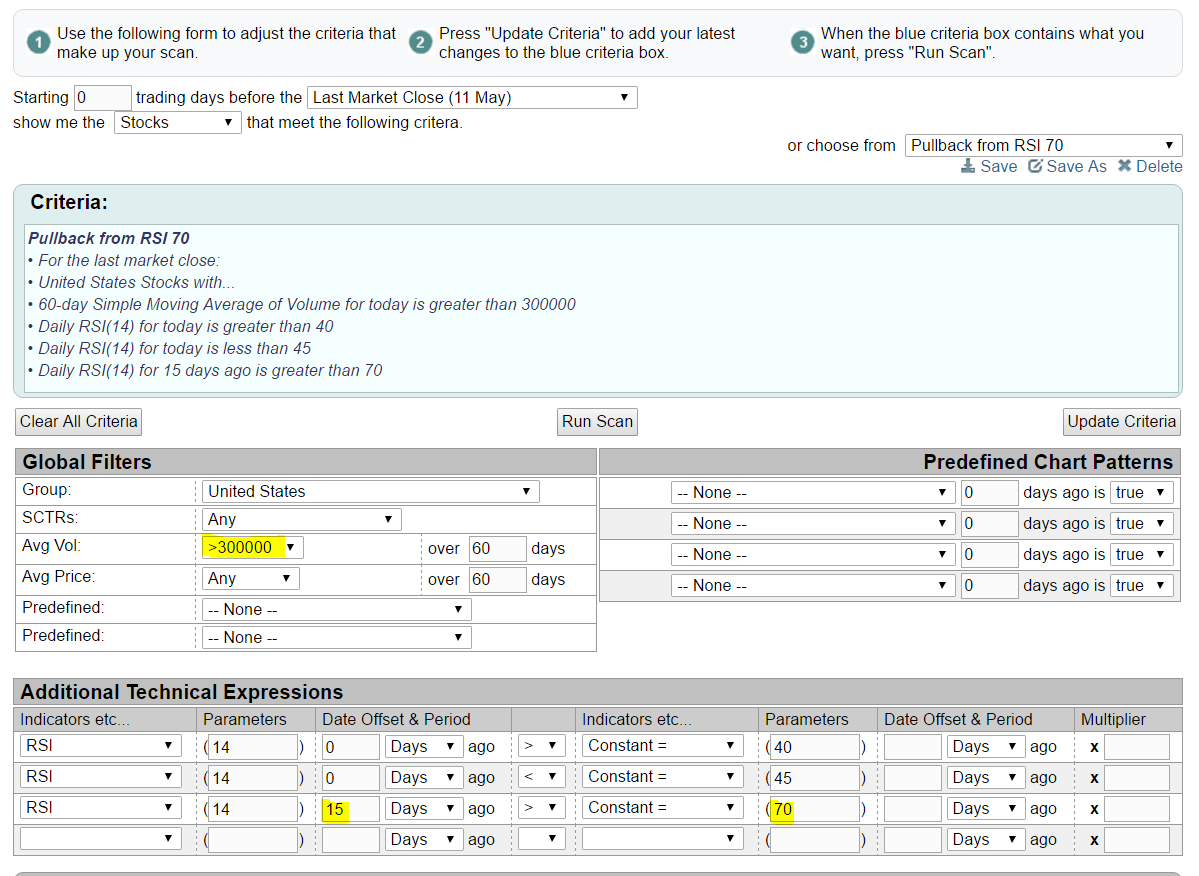
Overbought stocks frequently move above RSI 70, but during periods of selling or consolidation, it's fairly routine to see the RSI dip back to the 40-45 area. Here's a simple scan from the Standard Scan Workbench to find stocks that could be great trading candidates (from a long's perspective):
 I used average volume of "> 300,000" to ensure I was getting liquid stocks that trade frequently. The other highlighted numbers show that stocks had to have had an RSI reading of at least 70 fifteen trading days ago. With RSI now between 40-45, it ensures that the stock has encountered a period of profit taking.
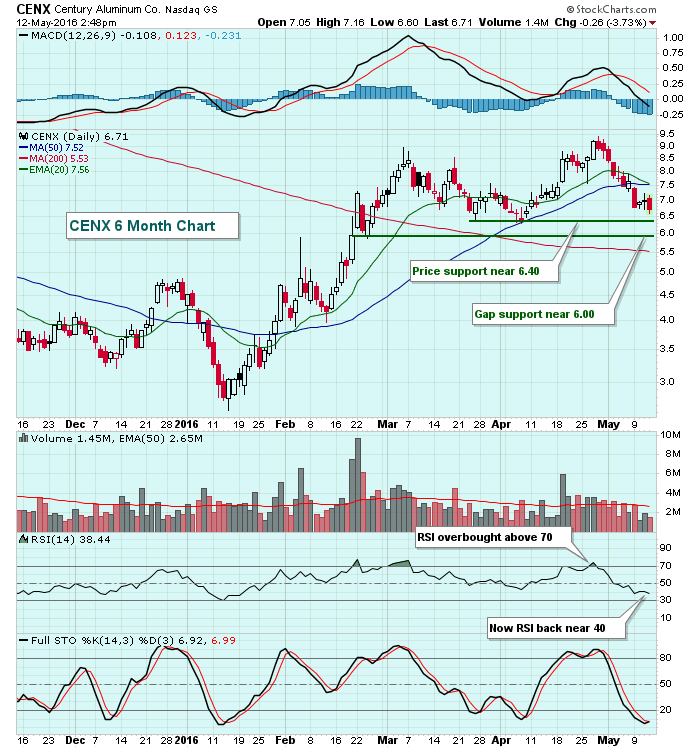
One stock that appeared on the scan results that's approaching a couple of key price support levels is Century Aluminum (CENX). Take a look:
 While the Standard Scan Workbench can provide outstanding trading candidates, a much better approach is to "customize" your scans based on the criteria you've found to be most successful in your trading plan. Chip Anderson will be hosting his ChartWatchers LIVE webinar this Saturday at 1pm EST and plans to discuss the scanning tools and capabilities available here at StockCharts. You don't want to miss this one! REGISTER NOW!
Happy trading!
Tom


