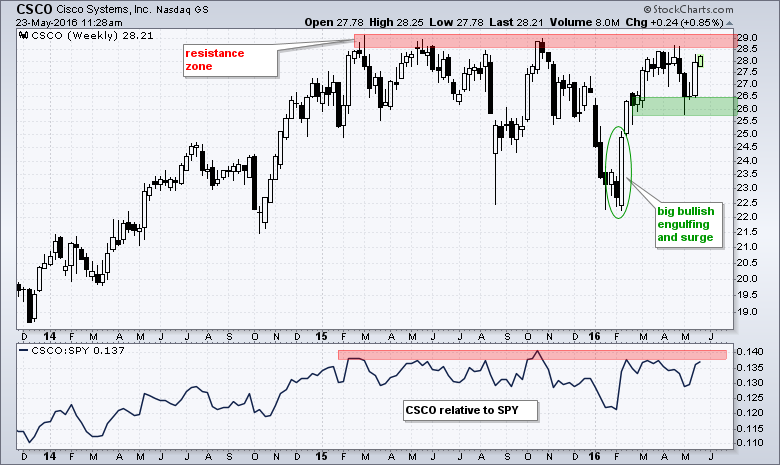
Stocks hitting 52-week highs are in clear uptrends and they are the market leaders. I am not going to feature a stock hitting a new high today, but rather look at one that has a good chance of hitting a new high in the coming weeks. The weekly chart below shows Cisco (CSCO) with a resistance zone extending back to the February 2015 highs. A break above this zone would put the stock at a 52-week high and be quite bullish. The indicator window shows the price relative with a similar resistance zone. A break above this zone would signal a breakout in relative performance. I will next look at the daily chart to assess the chances for a breakout.
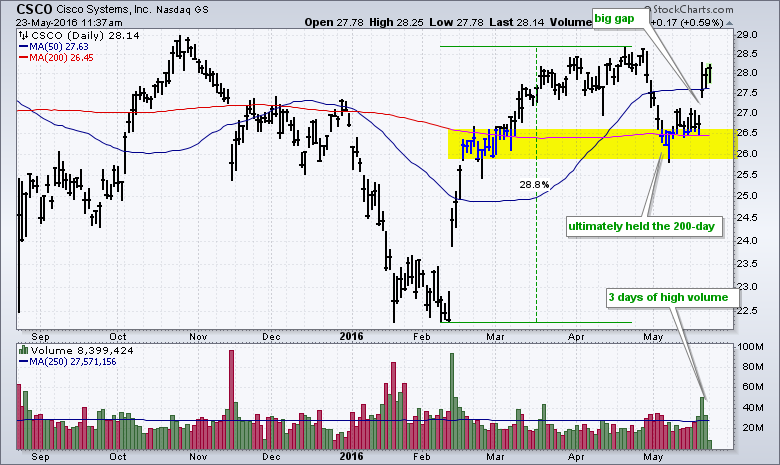
The daily chart shows the stock surging off the 200-day moving average with a gap and big volume. First, notice that the stock surged over 25% from early February to late April. Even though the decline back to 26 was sharp, it retraced around 50% of this advance and returned to the 200-day. This looks like a two-steps up and one-step back sequence. The gap and surge on high volume mark a successful test of the 200-day and the evidence is bullish right now. I would expect Cisco to move to new highs and potentially lead the market as long as the gap holds. Chartists can re-evaluate this bullish thesis on a close below 26.50.
 ****************************************
Thanks for tuning in and have a great day!
--Arthur Hill CMT
Plan your Trade and Trade your Plan
*****************************************


