The Healthcare sector has been out of favor and the Biotech ETF (IBB) was tossed into the bonfire with the rest of the sector. The SCTR is still demonstrating that the IBB is one of the worst performing ETFs in the market. So the real question is: Why would we post it in the Don't Ignore This Chart blog?
I keep a watchlist of biotech stocks and in the last few days, there have been significant moves in the biotech stocks. We can see the Relative Strength in purple is testing the trendline from the beginning of January. The price has bounced off support 3 times around this 250 level. Looking at the volume, it is a little light but that is not really a surprise for a sector so out of favor. The MACD gave a very positive signal cross as we can see on the zoom panel. The recent low on the MACD is much higher than the previous low in mid-February.
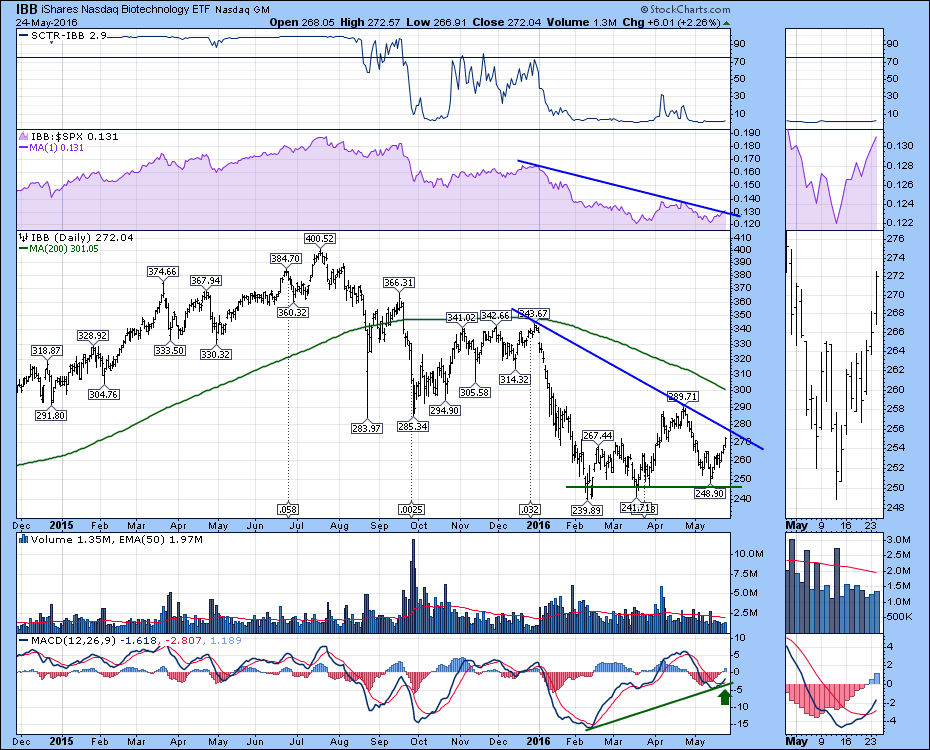
I will say there is a good reason to keep watching this chart. If it can break above the blue line on the price plot, this could be a new uptrend after pulling back for almost a year from the July 2015 highs. It would only need another day like today to be above the trend line.
Lastly, let's discuss the SCTR reading of 2.9. This is terrible. However, I do want to talk about the ranges. I particularly like the SCTR between 75-100 or below 25. I really try to avoid the middle 25-75 range. With a significant surge off the lows, there can be a lot of profits to be captured with a relatively tight stop. The green line around $247 only had one close below that level. If the biotech sector can kick off from here, an entry on the breakout from the trendline would be very bullish. If it falls back below the trend line, I would exit the trade as you are still in a weak sector. But after a 40% pullback to three tests of support, this looks like a good risk/reward ratio for an industry that has really large profit potential.
Good trading,
Greg Schnell, CMT, MFTA


